
Charles E.
Entrepreneur at Aggie Technologies
 USA
USA
All of the sprints were completed on schedule and on budget. We highly recommend RaftLabs!
Marketing Automation Software Development
Marketing teams are running campaigns, nurturing leads, and reporting on performance across more channels than ever, while most of the execution is still done manually. Emails sent one at a time, social posts scheduled individually, leads scored by gut feel, attribution assembled in a spreadsheet at the end of every month.
We build custom marketing automation software that handles the mechanical execution. Lead nurturing sequences triggered by real behaviour, campaign deployment across channels, lead scoring from actual engagement data, and attribution reporting that runs automatically. Your marketing team focuses on strategy. The execution runs without them.
Lead nurturing sequences triggered by actual prospect behaviour, not time delays on a generic drip
Multi-channel campaign deployment and content distribution without manual scheduling
Lead scoring built from your engagement and conversion data, updated in real time
Attribution reporting that calculates channel contribution automatically from your campaign and CRM data
Bring the problem, the current workflow, or the existing code. We reply with a practical next step within one business day.
Trusted by





























The brief
Good software decisions begin with the constraint, not a list of features or a preferred technology.
Marketing team spending hours each week manually scheduling content and segmenting lists instead of building campaigns?
Unable to tell which channels and campaigns are actually generating revenue, not just clicks?
Plain answer
RaftLabs builds custom marketing automation software for businesses across the US, UK, Europe, Canada, and the UAE. We handle lead nurturing, lead scoring, multi-channel campaigns, and attribution reporting. Most teams launch a validated v1 in 8 to 14 weeks at a fixed price, then iterate.
What to remember
Proof
Most marketing teams are using a combination of tools, an ESP for email, a social scheduling tool, a CRM for lead data, an ad platform for paid campaigns, and a spreadsheet for attribution. None of these systems talk to each other reliably. Leads fall between the gaps. Sequences run on the wrong segment. Attribution is assembled manually and is already out of date by the time anyone reads it.
In a 2026 Gartner survey of 402 CMOs, marketing leaders expected AI-driven automation of campaign work to more than double, from 16% of tasks today to 36% by 2028 (Gartner, May 2026). Teams still running execution by hand are widening that gap every month they wait.
Custom marketing automation connects your stack into a coherent system. Triggers in one platform drive actions in another. Lead data stays consistent across tools. Reporting is computed from the source, not assembled by hand.
Capabilities
Behavioural lead nurturing sequences triggered by real prospect actions, not fixed time delays. A lead who visited your pricing page twice this week is a different priority from one who went quiet six weeks ago. Triggers pull from your full stack: website events, email engagement, CRM stage changes, and product activity, and sequences branch on behaviour. When a lead's engagement score crosses a threshold, the system creates a CRM task and flags them as high intent, so no lead goes cold because an SDR missed a follow-up.
Campaign deployment triggered by schedule, segment change, or external events, not a marketer manually clicking send across platforms. Segments recalculate before every send, so an audience defined by CRM conditions always reflects current data, never a stale export. Personalisation pulls contact and account fields at send time, A/B variants pick their own winner automatically, and send times adjust to each contact's historical open pattern.
Lead scoring models built from your actual engagement and conversion data, not a generic points template. Behavioural signals like pricing page visits, email clicks, content downloads, and product usage combine with firmographic fit against your ICP to produce the MQL score. Scores decay when leads go inactive, so stale contacts never clog the high-intent queue, and threshold crossings trigger CRM actions automatically: SDR assignment, MQL status, or an alert.
Content distribution automation triggered by CMS publish events, calendar schedules, or campaign launches, so one published case study reaches every channel without a team member copying it across platforms. Formatting adapts per channel, and every distributed link carries generated UTM parameters, so attribution reporting traces traffic back to the exact piece and channel. Distribution logs and platform performance metrics feed the attribution system automatically.
Campaign performance data pulled automatically from every platform in your marketing stack on a daily schedule, no analyst pasting exports into a spreadsheet. Sources are normalised into one campaign taxonomy and loaded into a central store, then automated daily, weekly, and monthly reports go to the right people. Variance alerts flag a campaign whose cost per conversion breaks its ceiling before it drains a full cycle of budget.
Multi-touch attribution calculated from the full touchpoint history of every converted account, fixing the last-click problem where paid search gets all the credit for a multi-channel journey. Touchpoints come from tagged sessions, email clicks, ad conversions, CRM activity, and trial activations, and first-touch, last-touch, linear, time-decay, and position-based models run side by side for comparison. When a deal closes, revenue attributes back automatically, showing which channels create pipeline and which create revenue.
How it works
Every project follows the same four phases. Scope is locked and price is fixed before development starts.
We map your ESP, CRM, ad platforms, and analytics, then find where leads leak between them, which segments run off stale exports, and how consent and deliverability are handled today. You leave week 1 with a written scope, a lead-scoring and attribution model on paper, and a fixed-price quote. No development starts without your sign-off.
Data model, trigger logic, lead-scoring rules, and attribution model, all decided before any code. Field mapping between your CRM and sending tools is settled here, along with suppression lists and consent handling. A decision made now costs ten times less than the same fix in week 8.
Working automation in a staging environment by the end of sprint one. We test every sequence against seed lists, check rendering and inbox placement across major providers, and reconcile scores and attribution against known records before anything touches a live list. Bi-weekly demos. QA runs in parallel with every sprint.
A controlled cutover: sends start on a capped volume with bounce, open, and deliverability monitoring live from the first batch, so a misfiring sequence never hits your whole list. Eight weeks of post-launch support included in every project.
Why us
The engineers who assess your problem also build the solution. No bait-and-switch, no offshore handoff after the contract is signed. The team you meet in week 1 ships in week 12.
We scope the work, calculate the cost, and lock it in writing before any development starts. A scope change is a change request: priced, agreed, or dropped. It never absorbs into the project and appears on the final invoice.
Real engagements across SaaS, fintech, healthcare, and logistics, not every one published as a named case study. A decade of delivered products across AI, SaaS, mobile, and automation for healthcare, fintech, logistics, and hospitality.
Marketing automation lives or dies on consent and inbox placement. We scope GDPR consent handling, CAN-SPAM and CASL unsubscribe rules, suppression lists, and authenticated sending (SPF, DKIM, DMARC) in week 1, not as a fix before launch. Your sends reach the inbox, and your data handling holds up to an audit.
Every marketing automation system we build includes instrumentation for the metrics that matter: leads processed, sequences triggered, time saved per workflow, and revenue attributed per channel. You see the return, not just the system running.
What clients say
Three-year average engagement. Founders and operators describing the work in their own words. No marketing varnish.
Charles E.
Entrepreneur at Aggie Technologies
USA
All of the sprints were completed on schedule and on budget. We highly recommend RaftLabs!
01 / 02
Proof

A project-backed account of how RaftLabs helped UrShipper recover a stalled shipping platform, move 214 existing customers into the portal, and keep improving the product after the initial build.
Restaurant Automation, restaurant email campaigns, loyalty triggers, review requests
E-commerce Automation, abandoned cart, post-purchase flows, re-engagement
Loyalty Programme Development, loyalty-triggered marketing and personalised reward communications
Useful next steps
Work with us
Beauty Service Marketplace Development
See the serviceTry it yourself
AI Discoverability Review
A real person checks it. Not a scanner. 2 business days.
Open the free tool
Article
How to Build a Microblogging App Like Threads: A Decision-Maker's Guide
Building a microblogging app like Threads for a specific industry or membership group is not the same as building a social network. Here is what it costs, who builds these, and when a custom platform beats every off-the-shelf option.
Read more
Article
How to Build a Gaming Platform Like Roblox: Cost, Timeline, and What Actually Fails
Building a gaming platform like Roblox for EdTech, corporate training, or a media brand costs $150K-$800K and takes 24-60 weeks. This guide covers real costs, phased features, white-label alternatives, and the two failure modes that sink most projects.
Read more
Article
How to Build a Newsletter Platform Like Substack
Media companies, publishers, and professional associations paying Substack's 10% revenue cut outgrow it the moment paid subscriptions hit $10K/month. Here is what building a custom newsletter platform actually costs, how long it takes, and where most builds fail.
Read more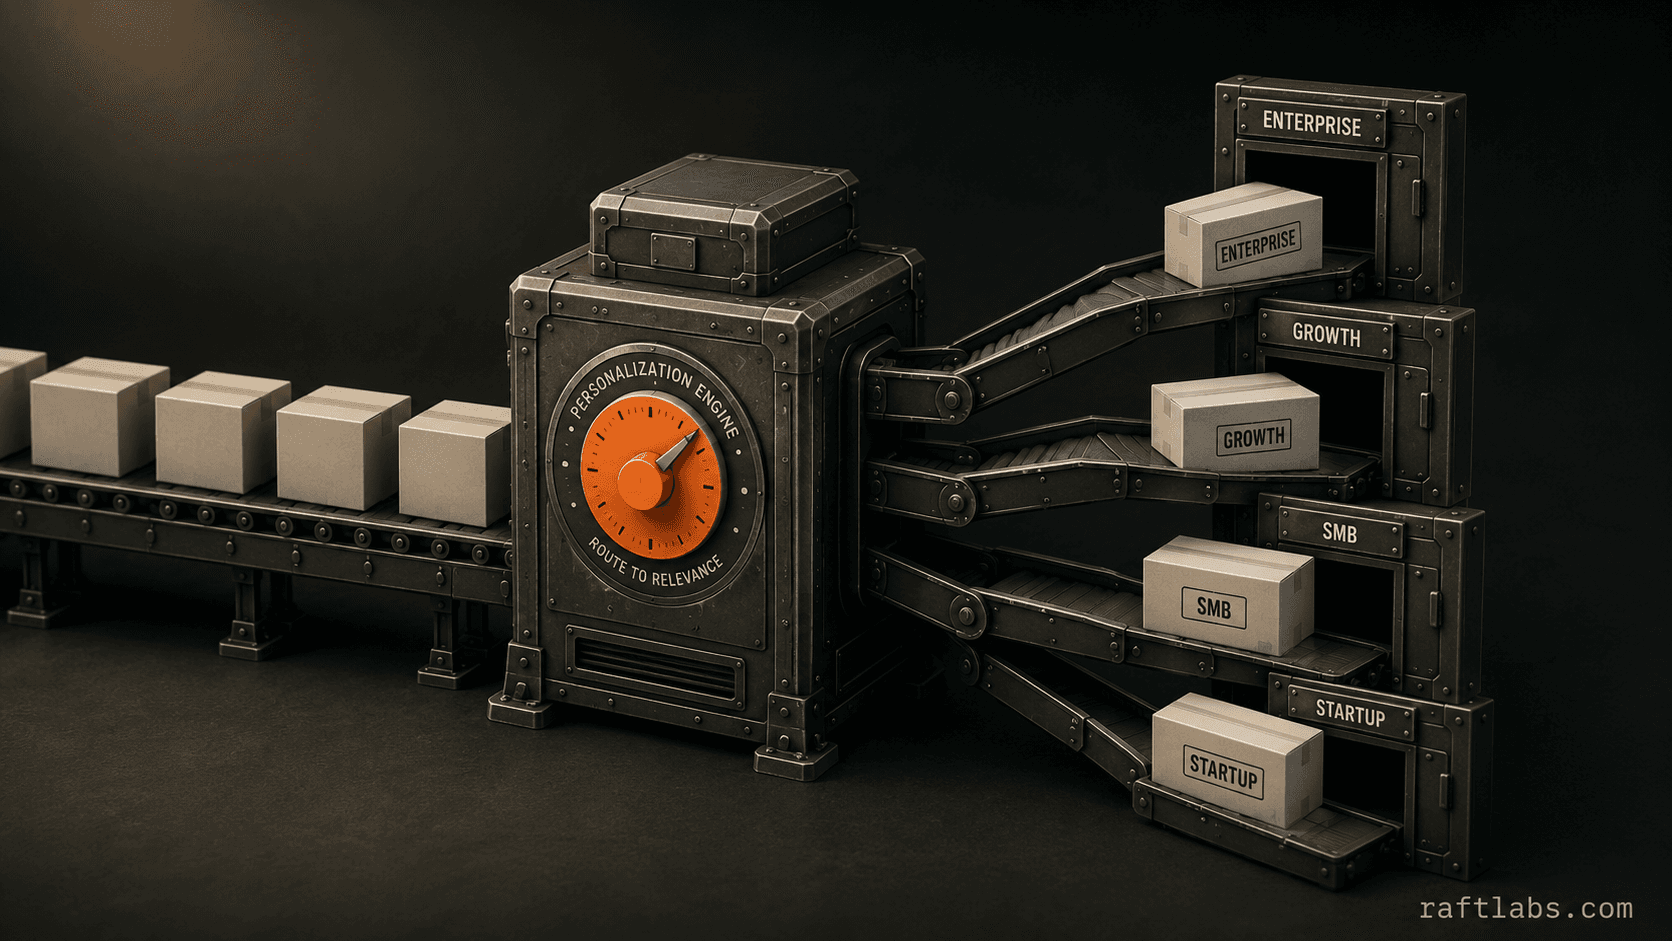
Article
How much does it cost to build an AI personalization engine?
Building a custom AI personalization engine costs $100,000–$350,000. Generic recommendation APIs plateau at 5–12% lift. A model trained on your own data typically reaches 18–30% lift within 6 months. Here is the full cost breakdown and build-vs-buy math.
Read moreMarketing automation development is building custom software that handles the execution side of your marketing operation automatically, rather than using an off-the-shelf platform that doesn't fit your specific process or data model. Generic platforms like HubSpot, Marketo, or Pardot handle standard use cases well. They fall short when your lead nurturing logic is complex, your attribution model involves custom touchpoints, your lead scoring needs to draw from multiple data sources, or your content distribution spans channels that no single platform natively supports. Custom marketing automation handles your specific process, integrates with your existing stack, and doesn't charge you per contact or per feature. We build the automation around how your marketing actually works, not around what a vendor decided is the standard workflow.
Lead nurturing automation sends the right content to the right lead based on what they've actually done, not based on what day they signed up. A lead who downloads a case study gets follow-up content relevant to the problem that case study addresses. A lead who visits your pricing page three times without converting gets a different sequence than one who opened a product email once. The triggers are events in your CRM, your website analytics, and your product, page visits, content downloads, email engagement, trial sign-ups, and any other signal your business can capture. Sequences branch based on engagement, exit when a lead converts, and escalate to sales when a lead reaches a score threshold. Custom nurturing sequences outperform generic drip campaigns because they respond to what a prospect actually does rather than putting every lead on the same time-based schedule.
Multi-channel attribution automation calculates which channels, campaigns, and touchpoints contributed to each conversion, automatically, using your actual data. Rather than a marketing analyst manually joining campaign data, CRM records, and revenue figures in a spreadsheet at the end of the month, the attribution system pulls from your ad platforms (Google, Meta, LinkedIn), your email platform, your CRM, and your revenue data on a schedule, applies your attribution model (first-touch, last-touch, linear, time-decay, or custom), and produces a report showing channel contribution to pipeline and revenue. You stop making channel budget decisions based on last-click data or on whoever assembled the spreadsheet most recently. Attribution runs automatically. The data is current. Budget decisions are based on actual channel contribution to revenue.
Off-the-shelf marketing automation platforms are built for the median use case. They work well when your process fits their workflow, your data lives in their ecosystem, and your contact volume falls within their pricing tier. Custom marketing automation is the right choice when your lead scoring logic draws from data sources the platform doesn't natively connect to, your attribution model is more complex than the platform supports, your content distribution spans channels that require custom integration, or you're paying per-contact fees that scale to a number that makes building cheaper than subscribing. Custom automation also means you own the logic and the data, there's no platform lock-in, no feature gating, and no seat-based pricing that grows with your team. We help you assess whether your requirements actually need custom automation or whether an existing platform handles them adequately.
Most marketing automation projects at RaftLabs fall between $25,000 and $80,000 depending on the number of channels, integration complexity, and the depth of the lead scoring and attribution models. A focused first version covering one channel, one nurturing sequence, and CRM integration typically launches in about 8 weeks. A full multi-channel system with attribution reporting and campaign analytics runs 12 to 16 weeks, then grows from there. We provide a fixed-price quote after a scoping session, so the number you see before development starts is the number on the final invoice.
Yes, we sign NDAs before any scoping conversation. All intellectual property, including source code, database schemas, and integration logic, transfers to you at project completion. There are no licensing fees, no ongoing platform costs beyond your own infrastructure, and no clause that keeps us in the loop for the system to function. You can run the system internally or hand it to any engineering team after delivery.
Work with us
Tell us your stack, your channels, and what's taking the most time. We'll design the automation and give you a fixed cost.