API development built as a product, not an afterthought.
A poorly designed API is a technical debt that compounds every time a developer touches it. New integrations take longer. Changes break things they shouldn't. Documentation doesn't match reality. We build APIs that are designed as products, with consistent patterns, versioning, clear error responses, and documentation that developers can actually use. Whether you need a RESTful API, a GraphQL layer, or a webhook architecture, we build it to last.
RESTful APIs, GraphQL, and webhook architectures
OpenAPI 3.0 documentation generated from the code, not written separately
Rate limiting, auth, versioning, and error handling built in from the start
100+ APIs built for products shipped across industries
Recent outcomes
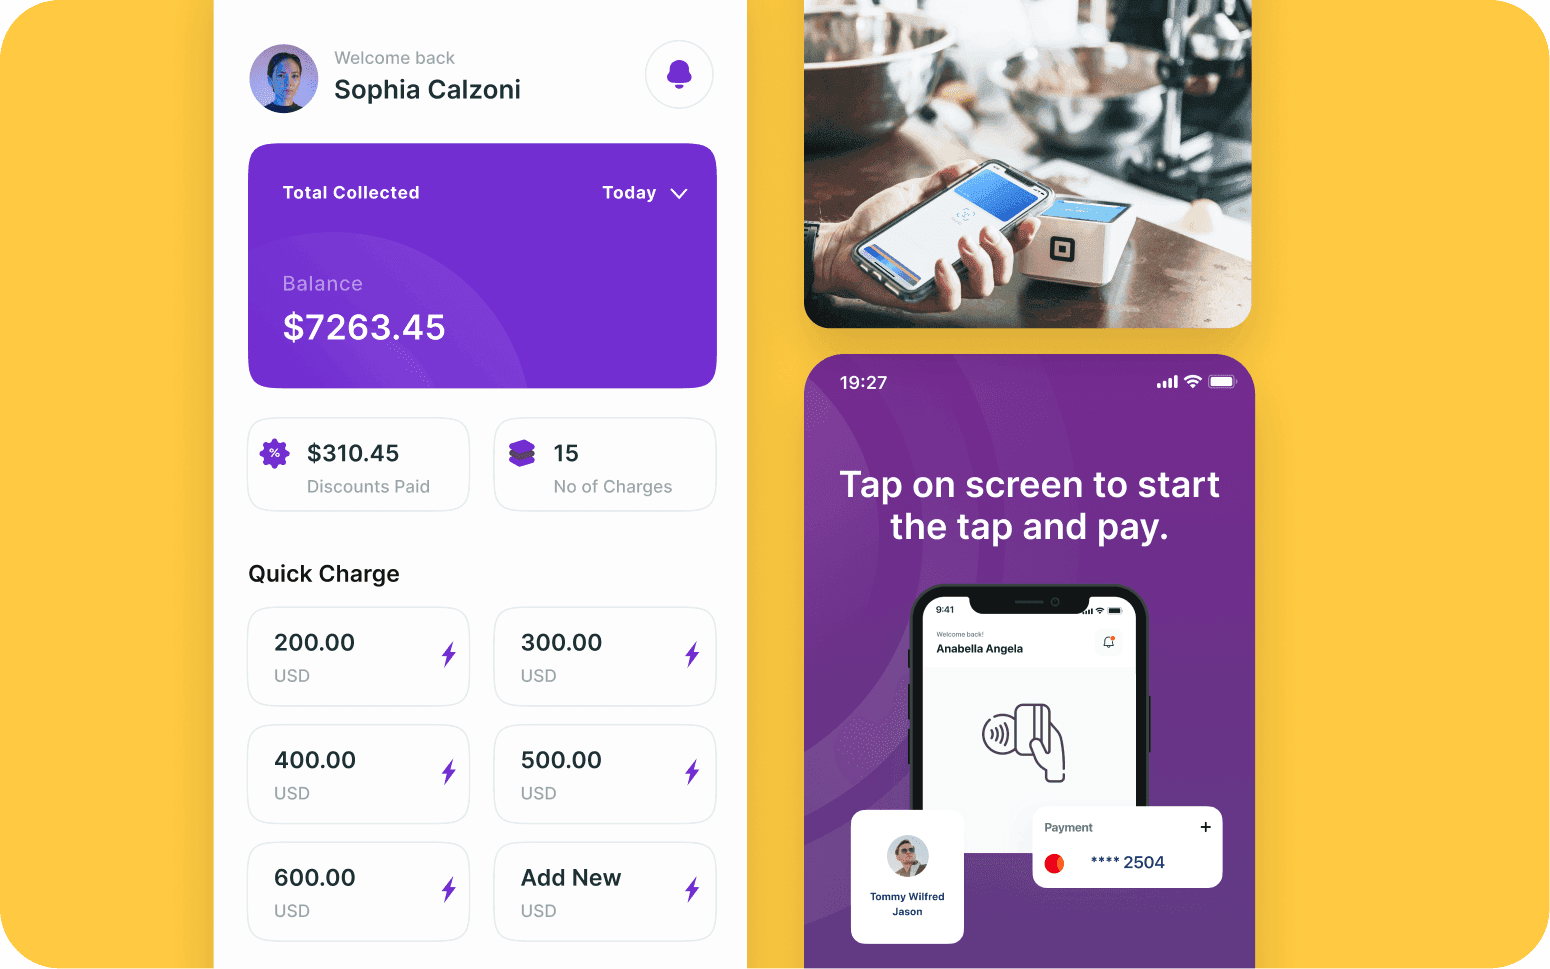
Payment API · UAE FinTech mobile POS
10,000+ transactions processed in 3 months
One payment-intents ledger sits in front of two processors (PayBy, Stripe). Gateway webhooks are signature-verified, fanned out to per-event SQS queues, and drained by idempotent workers that reconcile every charge by its natural key.
GraphQL API · UAE FinTech mobile POS
PCI DSS audit passed, 2025
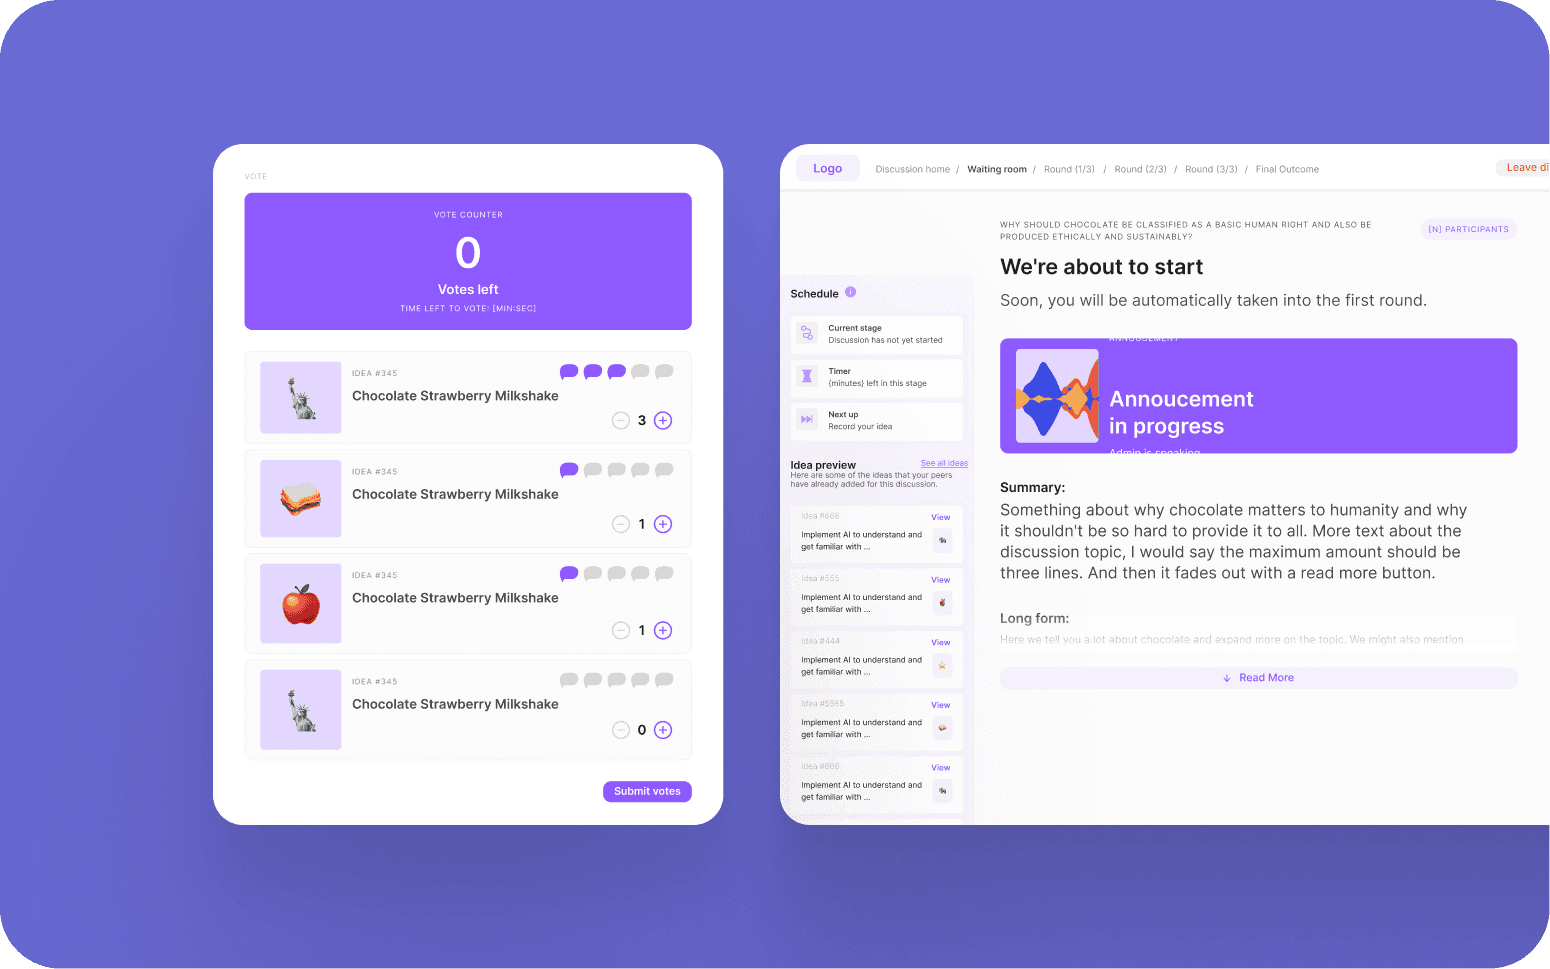
A GraphQL layer over a ~40-table domain model, with Hasura enforcing row-level permissions straight from JWT claims, so a super-admin, a merchant-admin, and a cashier each see only their own data.
Webhook integration · food-order platform
0% order errors after go-live
Built webhook receivers for three delivery-platform partners (GrabFood, GoFood, ShopeeFood), replacing manual order polling with events that land automatically.
Integrating your systems is taking months because your API wasn't designed for it?
Third parties can't use your API without calling your dev team for help?
Short answer
RaftLabs builds REST APIs, GraphQL layers, and webhook architectures for businesses across the US, UK, Europe, Canada, GCC, South Africa, and Southeast Asia. 100+ APIs shipped across 24 industries. Every build includes OAuth 2.0 auth, rate limiting, versioning, and OpenAPI 3.0 docs. Most builds run $8,000-$70,000 depending on scope, fixed price before development starts.
Key takeaways
RaftLabs has built 100+ APIs across 24 industries for businesses in the US, UK, Europe, Canada, GCC, South Africa, and Southeast Asia.
Every API build includes OAuth 2.0 auth, rate limiting, versioning, and OpenAPI 3.0 documentation generated from code.
RESTful, GraphQL, and webhook architectures are all supported depending on your use case.
A payment API for a UAE FinTech mobile POS platform processed 10,000+ transactions in its first 3 months on a single ledger across two processors.
The same platform's GraphQL layer, a ~40-table schema with Hasura row-level permissions, passed a 2025 PCI DSS audit.
Most API builds run $8,000-$70,000 depending on scope, with a fixed price agreed before development starts.
Trusted by
The integration that was supposed to take a week.
A partner signs on to consume your API. Their developer opens the docs, and the docs describe endpoints that no longer exist. A field that used to return a string now returns an object. A 400 comes back that just says invalid, with no hint which field failed. What was scoped as a week of integration work turns into three, most of it spent emailing your engineers.
None of this is the partner's fault. The API worked for the one system it was first built to talk to, and every integration after that paid interest on the shortcut.
A well-built API removes that tax. Consistent patterns, versioning, error responses that name the problem, and documentation generated from the code, so the next integration takes the week it was supposed to.
Most APIs are built as implementation details, a way for system A to talk to system B. They work for their original purpose and then create friction for everything that follows. A well-built API is the opposite: a product with a clear schema, consistent patterns, error codes that mean something, documentation developers can use without calling the team, and versioning that lets you make changes without breaking existing integrations.
That friction is now measured, not just felt. According to Postman's 2025 State of the API Report, 93% of API teams report collaboration blockers, and 55% specifically point to documentation that's inconsistent or missing. 69% of developers spend 10+ hours a week on API-related tasks that a well-built API would make unnecessary. The reward for getting it right is real too, 65% of organizations now generate revenue directly from their APIs, and of those, a quarter earn more than half their revenue through the API.
RaftLabs has built the APIs behind 100+ software products across industries since 2015, for clients including Vodafone, T-Mobile, Aldi, Nike, Cisco, and Lockheed Martin. The engineers who scope your API problem design and build it, GDPR, HIPAA, and SOC 2 requirements are scoped in week one rather than retrofitted before launch, and the price is fixed in writing before development starts. Most first releases reach production in about 12 weeks, and clients rate the team 4.9 out of 5 on Clutch.
Proof
100+
software products shipped since 2015, each with the APIs behind them
RaftLabs delivery record
12 weeks
typical time to a first API release in production
Typical API build
4.9/5
average client rating across delivered projects
Clutch, verified reviews
In January 2023, Twitter reportedly and abruptly cut API access for two long-running third-party clients, Tweetbot and Twitterrific had each run for over a decade, forcing both apps off the App Store within a week. It's a stark, real example of what's true at a smaller scale on every API: when someone else's business depends on yours, you own the consequences of every undocumented breaking change, every silently-deprecated field, every endpoint you remove without warning.
An API pays off when something real depends on consuming it.
Everything on the left should already be true for your build. Even one thing on the right, and a custom API is more than the job needs right now.
A fit
01
Business logic specific enough that a generic BaaS or API gateway product can't handle it cleanly.
02
External developers, partners, or multiple internal clients that need to consume the same API reliably.
03
Budget for a scoped build, and a decision-maker who can define what the API does and who consumes it.
Not a fit
Standard CRUD, authentication, and file storage that an off-the-shelf platform already covers well.
A single internal caller with no versioning or third-party consumption on the horizon.
Shopping for the cheapest hourly team, not a fixed-scope partner.
REST, GraphQL, or a third-party integration, which do you actually need?
Most teams land on this page before they've settled that question, and the honest answer depends on who's consuming the API, not on which style is fashionable.
Build a REST API
When you're exposing resources (orders, users, invoices) to a predictable set of consumers, and each consumer needs roughly the same shape of data. REST is simpler to document, cache, and debug than GraphQL, and every HTTP client already understands it. See [REST API development](/services/api-development/rest-api-development) for scope and pricing.
Build a GraphQL API
When different clients need meaningfully different slices of the same data, a mobile app that wants three fields and a web dashboard that wants forty. GraphQL cuts over-fetching and lets each client query for exactly what it needs, at the cost of more upfront schema design. See [GraphQL API development](/services/api-development/graphql-development) for scope and pricing.
Integrate a third-party API
When the API you need already exists, a payment processor, a CRM, a government registry, and the job is connecting to it reliably rather than building your own. See [Third-party API integration](/services/api-development/third-party-api-integration) for scope and pricing.
Most real systems end up using more than one: a REST API for resources, webhooks for events, and third-party integrations for the services you don't need to own. We'll help you land on the right combination in the first call.
What we build
APIs we design and build
01
RESTful APIs
Resource-based REST APIs with consistent naming, HTTP method semantics, status codes that match the outcome, and pagination patterns that work at scale. Built on Express, Fastify, or Django, with the OpenAPI 3.0 spec included.
02
GraphQL APIs
GraphQL schemas designed around your domain model with resolvers that don't generate N+1 queries. DataLoader-based batching, persisted queries, and subscription support for real-time features, with strong typing for safe schema evolution.
03
Webhook systems
Event-driven webhook architectures that notify external systems of state changes in real time. Delivery with retry logic, signature verification for consumer authentication, an event log for debugging, and a developer dashboard, built to handle the volume and reliability that third-party integrations require.
04
Third-party API integrations
Integrations with payment providers, CRM systems, ERP platforms, identity providers, and data services. We handle the OAuth flows, the rate limiting, the error handling, and the data transformation so your application gets clean, reliable data from external services.
05
API gateways and management layers
For organizations with multiple backend services, we build API gateways that centralize authentication, rate limiting, logging, and routing. A single entry point for external and internal consumers, with per-client rate limits, usage analytics, and a developer portal for API key management.
06
Public developer APIs
APIs designed for external developer consumption, with developer registration, API key issuance, usage dashboards, and full documentation. We build the API, the developer portal, and the onboarding flow so third-party developers can integrate without needing to call your team.
What good API design looks like
The things we build into every API that most agencies don't.
01
Error messages that tell you what's wrong
A 400 error that returns {error: invalid} is useless. A 400 that returns the specific field that failed validation and why saves a developer 30 minutes of guessing. We design error responses as part of the API contract, with field-level validation errors, human-readable messages, and machine-readable codes.
02
Documentation that matches the code
Documentation written separately from the code drifts. We generate API documentation from OpenAPI annotations in the code itself, so what's documented is what's deployed. Developer portals, endpoint references, and authentication guides are all produced as part of the build.
03
Rate limiting and abuse prevention built in
Rate limits, IP blocking, and request throttling designed before the API goes live, not added when someone starts hitting it in ways you didn't anticipate. Per-client limits, burst allowances, and 429 responses with Retry-After headers. Standard API security, not an afterthought.
We are not tied to one framework. We pick the API style and stack that fit your consumers, performance targets, and handover needs, then document every choice so any competent engineering team can maintain it. The technologies we reach for most often:
Layer
Technologies we use
Where it fits
API styles
REST, GraphQL, gRPC, WebSockets
Resource APIs, flexible client queries, service-to-service calls, and real-time streams
Backend
Node.js, NestJS, Python, FastAPI, Go
API logic, resolvers, and high-throughput services
Data
PostgreSQL, MongoDB, Redis
Relational data, flexible documents, caching, and rate-limit counters
Gateway and auth
Kong, Apigee, OAuth 2.0, JWT
Centralized routing, per-client rate limits, and secure access control
Cloud and DevOps
AWS, Docker, Kubernetes, CI/CD
Containerized, production-grade deployment and OpenAPI spec validation
The rule holds at every layer: no proprietary frameworks that lock you in, and no stack we cannot hand to your team on day one.
API and integration work we do by industry
The API changes with the domain. Compliance-heavy sectors need audit trails and scoped access designed in from the first sprint, while high-volume platforms need caching, idempotency, and rate limiting that hold up under real traffic. We build APIs and integrations for:
FinTech and financial services: payment, lending, and reporting APIs with OAuth 2.0, audit logging, and compliance-first design.
Healthcare and life sciences: HIPAA-ready APIs and integrations for clinical data, EHR systems, and patient platforms.
Retail and e-commerce: storefront, inventory, and order APIs connecting POS, ERP, and third-party marketplaces.
Logistics and supply chain: APIs linking suppliers, carriers, and warehouse systems, with webhook-driven event tracking.
Insurance: claims, underwriting, and policy APIs that integrate legacy systems behind a clean modern interface.
Manufacturing: APIs connecting production systems, IoT devices, and operations dashboards.
What an API build costs
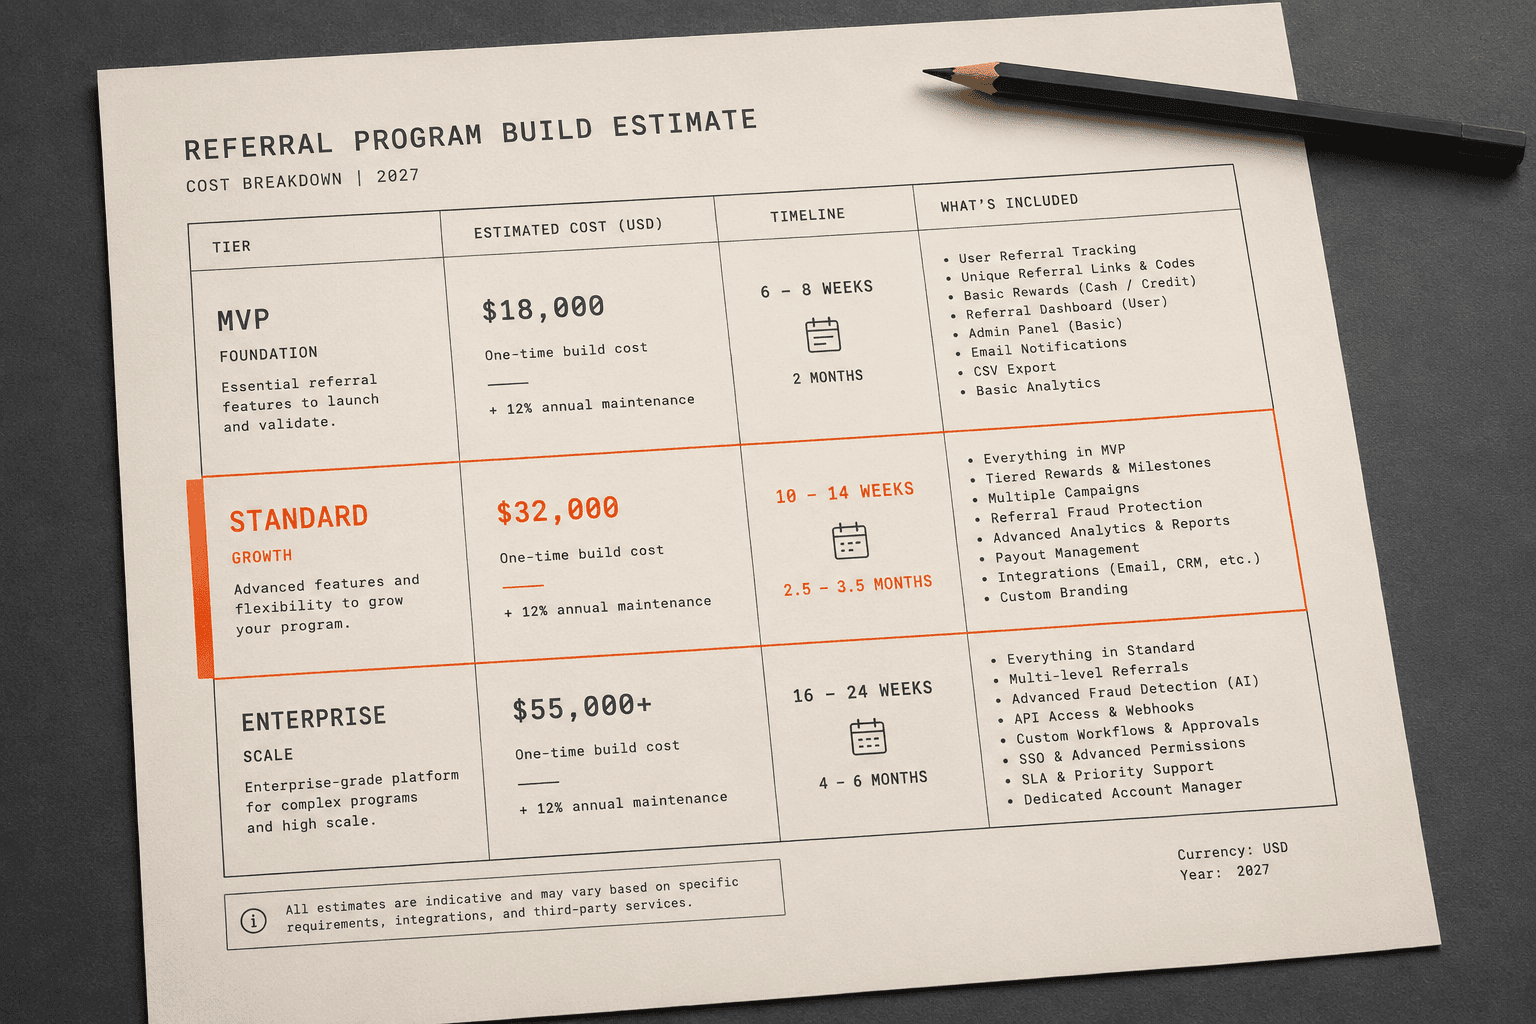
Most API builds run $8,000-$70,000 depending on scope. A single REST endpoint set for internal use sits at the low end; a bidirectional GraphQL integration with multiple external partners sits at the high end. The number depends on which of the three you're building:
REST API
$20,000-$50,000, typically 6-14 weeks. See [REST API development](/services/api-development/rest-api-development) for what drives the range.
GraphQL API
$25,000-$60,000, typically 6-14 weeks. See [GraphQL API development](/services/api-development/graphql-development) for what drives the range.
Third-party integration
$8,000-$25,000 for a single service, $25,000-$70,000 for complex, bidirectional sync. See [Third-party API integration](/services/api-development/third-party-api-integration) for what drives the range.
The price is fixed in writing before development starts, whichever of the three (or combination) your build turns out to be.
Building an API? Let's design it properly from the start.
Tell us what systems need to connect and who will consume the API, and we'll design a spec before writing a line of code.
How it works
How we work
Step 01
01
API design and specification
We design the API before writing any code. Resource naming, endpoint structure, authentication model, versioning strategy, error response format, and pagination pattern are all specified in an OpenAPI 3.0 document. Your developers, partners, and future maintainers use it as the source of truth.
Resource and endpoint design with clear naming conventions
Authentication and authorization model (OAuth 2.0, JWT, API keys)
Error response design with field-level validation messages
OpenAPI 3.0 specification produced before build begins
Step 02
02
Authentication and security design
Every API we build has authentication and security designed in from the start. Rate limiting, scope-based permissions, IP allowlisting where needed, and abuse prevention logic are part of the specification, not features added after the API has already been exposed.
OAuth 2.0 flow design for your use case (client credentials, auth code)
Rate limiting strategy with per-client limits and burst allowances
Scope-based permission model
Input validation and injection prevention
Step 03
03
API build
We build the API against the agreed specification using your stack (Node.js/Fastify, Django/DRF, Go, or others). Tests are written alongside the code. The implementation is validated against the OpenAPI spec continuously, so the documentation matches what's deployed.
Implementation in your preferred stack
Unit and integration tests against the spec
OpenAPI spec validation built into CI
Request and response logging for debugging
Step 04
04
Documentation and developer experience
Documentation is generated from the code, not written separately. We produce endpoint references, authentication walkthroughs, example requests, and error code glossaries. For public APIs, we set up a developer portal. Developers can integrate without calling your team.
OpenAPI-generated endpoint reference
Authentication walkthrough and token guide
Example requests for common use cases
Developer portal setup (Swagger UI, Redoc, or custom)
Step 05
05
Integration support and monitoring
We support the first integrations from your internal teams or external partners. Post-launch monitoring covers request volume, error rates, latency percentiles, and rate limit hits, so you know when the API is under stress before consumers start complaining.
Integration support for initial consumers
Production monitoring dashboards
Alerting for error rate spikes and latency degradation
Versioning plan for future breaking changes
What clients say
What our clients say
Three-year average engagement. Founders and operators describing the work in their own words. No marketing varnish.
K
Kelly Smith
UAE
Product Manager
“
RaftLabs helped us develop a mobile POS app that enabled smooth cashless payments. Their clear communication and collaborative approach kept the project running smoothly from start to finish, making the entire process efficient and successful.
Use an off-the-shelf API platform (like a BaaS or an API gateway product) when your use case is standard, simple CRUD operations, user authentication, file storage. Build a custom API when your business logic is specific enough that generic platforms can't handle it cleanly, when you need to orchestrate multiple data sources, when performance requirements are tight, or when you're building an API that external developers or partners will consume. If you're spending more time configuring a platform to match your logic than the platform is saving you, it's time for a custom build.
REST works for most cases, it's well understood, simple to document, and well supported by every HTTP client. GraphQL is better when your API is consumed by clients with very different data requirements (a mobile app that needs minimal data vs. a web dashboard that needs everything), it reduces over-fetching and makes schema evolution easier. Webhooks are the right choice when external systems need to be notified of events in real time rather than polling. Most systems use a combination: a REST API for resources, webhooks for events, and sometimes GraphQL for a frontend data layer.
For APIs consumed by third parties, we implement OAuth 2.0 with client credentials (machine-to-machine) or authorization code flow (user-facing). For internal APIs, JWT-based authentication with role-based access control. We implement API key management for simple public API access patterns. Rate limiting, IP allowlisting, and scope-based permission systems are part of the standard build, not add-ons.
Yes, and it's generated, not hand-written. OpenAPI annotations live in the code itself, next to the endpoint they describe, so a docs build reads the current implementation rather than someone's memory of it. If a field changes and the annotation doesn't, a CI validation step catches the mismatch against the live schema before merge. That's the specific mechanism that stops documentation from drifting the way a separately-maintained wiki page does. For APIs with external consumers, we also produce usage guides, authentication walkthroughs, and example requests for common use cases. We can host documentation on Swagger UI, Redoc, or a custom developer portal depending on your needs.
We build versioning into the API from the start, URL path versioning (/v1/, /v2/) for REST APIs, or schema versioning for GraphQL. Breaking changes are introduced in new versions, not applied to existing ones. The deprecation policy is written down before launch, not improvised later. It fixes a support window for the old version (typically 6-12 months), announces a sunset date to consumers on day one of the new version, and adds a deprecation header to every response from the old version, so client teams get an automated warning instead of a surprise email.
Yes. This is a common approach for organizations that want to modernize the interface to a legacy system without replacing the system itself. We build a modern API layer that translates requests into whatever format the legacy system understands, and transforms the response into a clean, well-structured output. Consumers of the new API don't see or know about the legacy system behind it. This is often the first step in a broader legacy modernization program.
Work with us
Tell us what you need. We'll tell you what it would take.
We scope API Development Services in 30 minutes. You walk away with a clear cost, timeline, and approach. No commitment required.
Scope and cost agreed before work starts. No surprises. No obligation.
Working prototype within 3 weeks of kickoff.
Pay by milestone. You see progress before each invoice.
60-day post-launch warranty. Bug fixes, UI tweaks, and deployment support. No retainer.