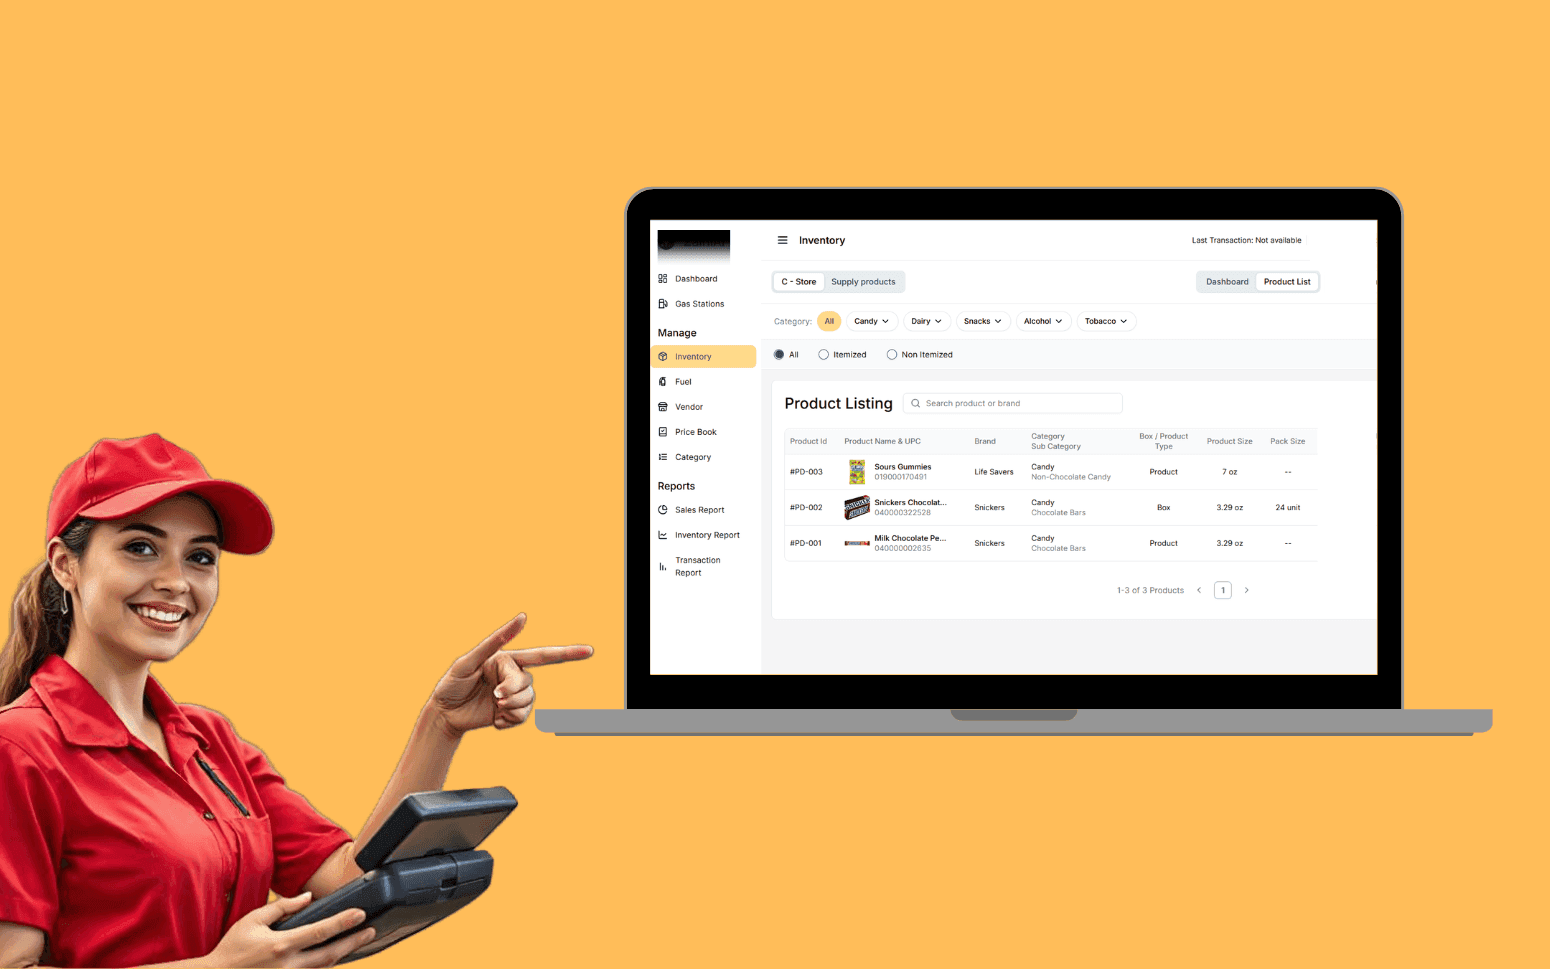
AI OCR Software Scales Gas Station Operations With 20K+ Transactions
- 20K+
- 40+
- 70%
Custom production management software for upstream E&P operators and midstream companies who need daily production reporting, well performance tracking, and SCADA integration built around their specific asset base and reporting obligations.
Manually compiling production reports from SCADA exports, flow computer readings, and field notes consumes engineering time that should be spent on optimisation. We build the platform that automates data collection, calculates production allocation, and surfaces the well performance data your engineers need to make decisions.
Automated daily production reporting pulling data from SCADA, flow computers, and field measurement systems
Well performance tracking with production history, decline curve data, and deviation alerts
Downtime event logging with cause categorisation and production deferment calculation
Production allocation across multiple wells and facilities with partner and regulatory reporting
Recognition
Production engineers spending two hours every morning compiling the daily production report from SCADA exports, field measurement data, and handwritten logs rather than analysing what the numbers mean?
No reliable way to calculate production deferment from downtime events, making it impossible to report accurately to partners or management on what production was lost and why?
In short
RaftLabs builds custom production data and well management software for upstream oil and gas operators. A production management platform covers automated daily production reporting from SCADA and field measurement data, well performance tracking, downtime event logging with deferment calculation, production allocation across wells and facilities, and integration with existing SCADA systems. Most projects deliver in 12 to 16 weeks at a fixed, agreed cost.
Companies we've built for








Production data in a typical mid-size upstream operation lives in three or four places simultaneously: SCADA historian, flow computer memory, field technician logs, and a shared spreadsheet that someone updates every morning. The daily production report is a manual assembly exercise. By the time it's complete, the data is already hours old. Discrepancies between what SCADA recorded and what the field log says take another hour to resolve. The result is engineers spending their morning on data administration rather than production management.
We build the production management platform that automates data collection from your existing measurement systems, calculates allocation and deferment, and delivers a daily report that's complete before the morning meeting starts. We integrate with SCADA systems, flow computers, and field measurement equipment rather than replacing them. Your engineers work with better data faster, not with a new system that requires them to re-enter what SCADA already knows.
Production data pulled automatically from SCADA historians, flow computers, and tank gauge systems at configurable intervals: hourly, shift, or daily. Data quality checks run on import: readings outside expected ranges, missing data points, and anomalies are flagged for review before the report is finalised. The daily production report generates from confirmed data and is distributed to the production team, management, and partners in the required format without manual assembly. Historical report archive is accessible for any date with the underlying data, quality flags, and any manual corrections applied. Report templates are configurable for different regulatory and partner reporting formats so the same underlying data produces multiple output formats without duplicate data entry.
Production history for each well with oil, gas, and water volumes plotted over time and compared against the production forecast or type curve. Gross to net calculations and shrinkage factors are applied consistently to give a single source of truth for production volumes across all reporting purposes. Gas-oil ratio and water cut trends are tracked per well with alert thresholds to flag wells where performance is deviating from expected behaviour before the deviation becomes a significant production loss. Well test data is recorded with test frequency, method, and resulting well rates so the production allocation model is based on current well performance. Production potential tracking for wells on artificial lift or gas lift makes optimisation data accessible to the production engineering team.
Downtime events logged in real time by field technicians or automatically detected from SCADA data when production falls below a configurable threshold. Each downtime event is categorised by cause: planned maintenance, unplanned equipment failure, regulatory hold, third-party constraint, or weather. Production deferment is calculated automatically from actual versus potential production for the duration of each event. Deferment reporting by cause category, asset, and time period lets management and partners see not just total deferment but its breakdown. Root cause analysis fields on each downtime event make recurring failure modes visible in the deferment data. Partner and regulatory deferment reports generate from the same underlying data without separate manual compilation.
Production allocation from measured facility totals back to individual wells using the well test ratios, meter factors, and allocation methodology defined in your production sharing or joint operating agreements. Allocation calculations run automatically when facility production is confirmed, with results traceable to the input data and allocation rules applied. Retroactive allocation adjustment is supported when well test ratios are updated or meter calibrations change, with full audit trail of the change and the affected periods. Multi-facility and multi-field allocation handles operators with complex gathering networks where production from multiple wells commingles before measurement. Partner reporting calculates each partner's working interest share and formats it for submission.
Data integration with existing SCADA platforms, OSIsoft PI (AVEVA PI), Wonderware, Ignition, and proprietary SCADA systems, via OPC-UA, REST API, or direct historian query. Flow computer data integrates via Modbus, serial, or vendor-specific protocols. Tank gauge and measurement system integration handles tank farm operations. Data is collected at the configured frequency with timestamp, quality flag, and source system recorded for every reading. No SCADA replacement is required: we build the production management layer on top of your existing measurement infrastructure. Integration architecture is documented during discovery so your SCADA and instrumentation team can review and approve the data extraction approach before development begins.
Production history export in formats compatible with reservoir engineering tools (Petrel, Eclipse, OFM, Harmony) so engineers can move between the production management platform and their analysis tools without re-entering data. Decline curve visualisation within the platform supports quick performance assessment without opening a separate engineering application. Production forecast versus actual comparison by well, field, and total asset includes variance tracking over time. Well intervention history links to the production record so the production impact of each workover, stimulation, or completion change is visible in the data. Material balance data exports support reservoir management teams managing pressure maintenance or secondary recovery programmes.
We've integrated with OSIsoft PI (now AVEVA PI System), Wonderware (AVEVA System Platform), Ignition, GE iFIX, and several proprietary SCADA platforms used by smaller operators. Data extraction uses OPC-UA where the SCADA system supports it, direct historian queries for PI and Wonderware, or REST API where available. For flow computers, we connect via Modbus TCP, Modbus RTU, or the vendor's proprietary protocol. The integration approach for your specific SCADA and measurement systems is confirmed during discovery and documented before development starts, so your SCADA and instrumentation engineers can review and approve it. We don't replace SCADA: we read from it.
Allocation methodology is configurable to match your joint operating agreement or regulatory requirements. For operations where well tests are infrequent, the system applies the most recent well test ratio for each well until a new test supersedes it, with the test date and expiry period tracked so the allocation model reflects how current each well's test data is. When a new well test is completed, the system can apply the updated ratio from the test date forward or retroactively to a defined date, with full audit trail. Operators with more frequent measurement, individual well meters or production separators, can configure the allocation to use those measurements directly rather than well test ratios. The allocation model is reviewed and agreed with your production engineering team during discovery.
Yes. Production reports for partners, co-venturers, and regulators are generated from the same underlying production data, applying the working interest shares and formatting requirements for each recipient. For joint venture operations, each partner receives a report showing total field production, their working interest share, and the allocation methodology applied. Regulatory production reports for energy regulators and environmental agencies are formatted to the submission requirements for the relevant jurisdiction: we confirm the specific formats required during discovery. Where regulators accept digital submission, we can generate files in the required format for direct upload. Where paper or email submission is required, the report is formatted for print or attachment.
A production management platform covering automated daily production reporting, SCADA integration for up to three source systems, downtime and deferment tracking, and a web dashboard for the production team typically runs $55,000 to $100,000 depending on the number of wells, measurement systems, and reporting formats required. Adding production allocation for a joint venture operation with multiple working interest partners typically adds $20,000 to $40,000 depending on the allocation methodology complexity. A full platform including well performance analytics, decline curve visualisation, and regulatory reporting adds further scope scoped during discovery. We price every project at a fixed cost agreed before development starts.
What clients say
Three-year average engagement. Founders and operators describing the work in their own words. No marketing varnish.

 USA
USAAll of the sprints were completed on schedule and on budget. We highly recommend RaftLabs!
01 / 02
Tell us your asset base, current SCADA and measurement setup, and the reporting obligations you need to meet. We'll scope the right platform.