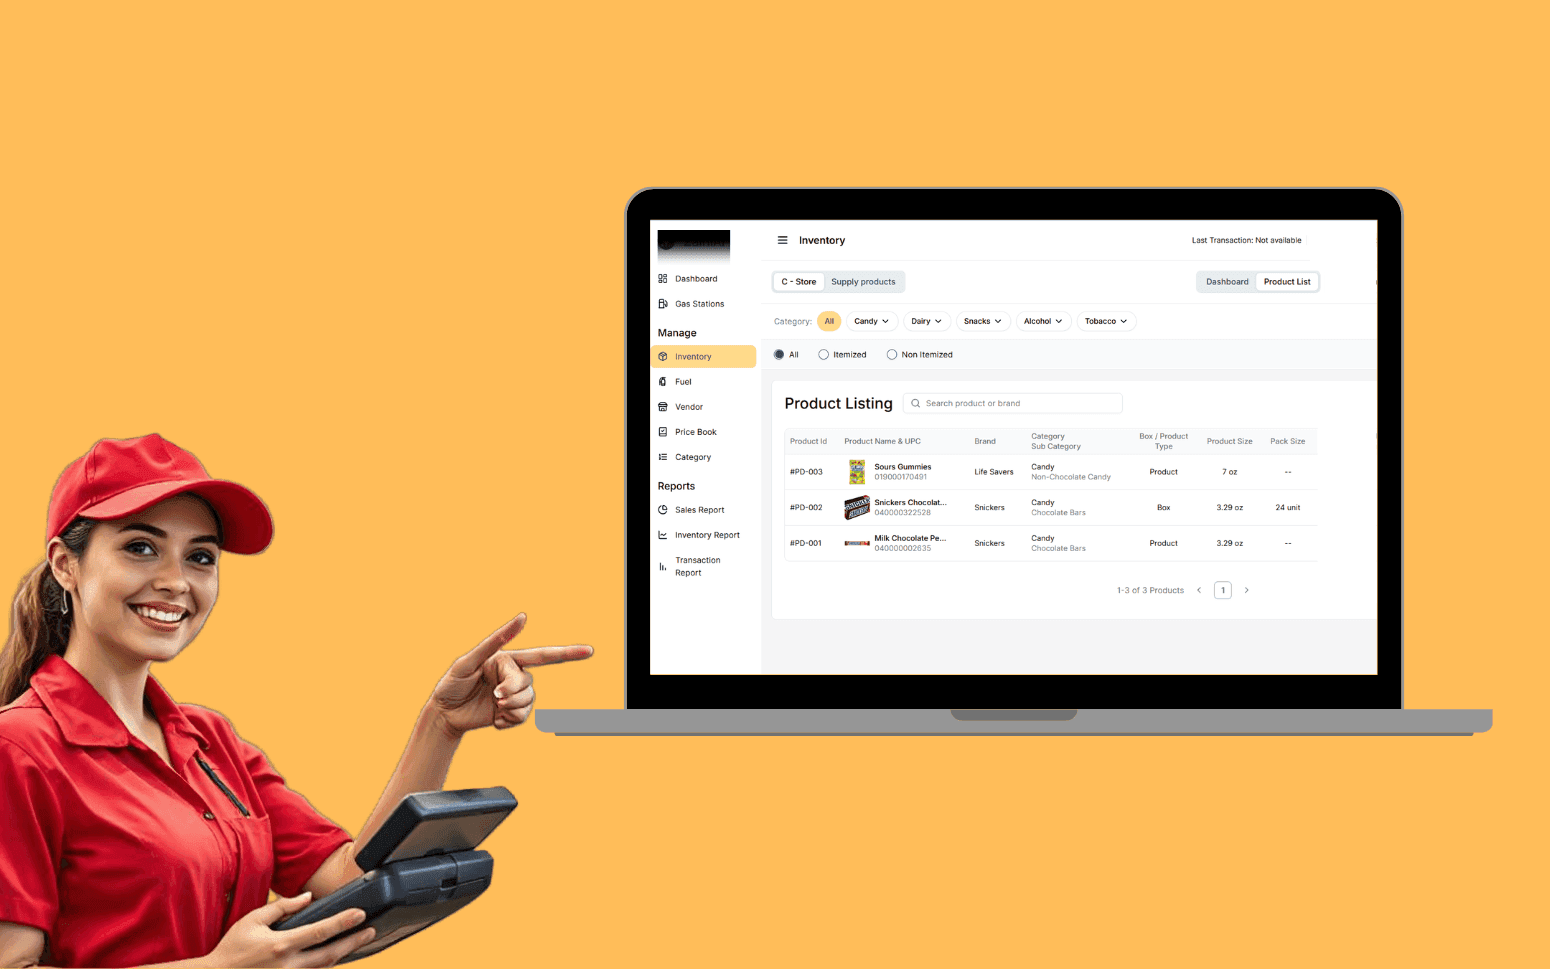
AI OCR Software Scales Gas Station Operations With 20K+ Transactions
- 20K+
- 40+
- 70%
Computer vision systems that inspect every unit at production line speed, detect defects that human inspectors miss on fatigued shifts, and classify defect type and severity automatically without slowing throughput.
The shift from statistical sampling and end-of-line inspection to 100% inline inspection with real-time defect data feeding your SPC system and production team.
Computer vision defect detection trained on your specific defect types and product variants
Inline inspection at production line speed with 100% coverage and no throughput impact
Defect classification by type and severity with confidence scores and image capture for every rejection
Real-time defect rate data feeding your SPC system for process control and root cause analysis
Recognition
Manual visual inspection missing defects that reach customers because inspectors fatigue over a 10-hour shift?
Sampling-based QC passing defective batches that inspection missed because you cannot check every unit?
Defect data arriving too late in the process to correct the root cause before more scrap is produced?
In short
RaftLabs builds AI quality control software for manufacturing operations, covering computer vision defect detection trained on your product images, anomaly classification that distinguishes defect types and severity, inline inspection integration with production lines, SPC (statistical process control) data feeds from inspection results, rejection workflow automation, and quality analytics dashboards. AI visual inspection typically achieves 95-99% defect detection accuracy on trained defect categories, operates at production line speed without slowing throughput, and reduces false rejection rates compared to manual inspection. Most quality control AI projects deliver in 10-16 weeks at a fixed cost.
Companies we've built for








Visual inspection by human operators is consistent at the start of a shift and inconsistent by hour eight. The defect detection rate drops as concentration wavers. Some defect types, including surface micro-cracks, colour variation, and dimensional tolerance deviations, are at the edge of human visual discrimination even under ideal conditions.
Statistical sampling catches defects in aggregate. It doesn't prevent defective units from shipping until the batch rejection threshold is crossed. By then, the root cause has been running for hours.
AI visual inspection checks every unit at line speed, with consistent accuracy regardless of shift length, and feeds real-time defect data into your SPC system while the process can still be corrected.
Defect detection models trained on your product images using architectures matched to your inspection task. ResNet-50 and EfficientNet-B4 are strong baseline choices for image classification tasks where the defect occupies a known region of the frame. YOLOv8 is preferred for object detection tasks where multiple defect instances can appear at arbitrary positions within the image and bounding box localisation is required alongside classification. Model architecture selection is driven by your defect type, throughput requirement, and available inference hardware, not by a single-architecture default.
Image datasets are built using annotation tools such as CVAT (Computer Vision Annotation Tool) or Label Studio, with your quality engineers defining the labelling standard: what constitutes a reject, what is a borderline case requiring secondary review, and what is acceptable product variation that the model should pass. A consistent labelling standard applied before annotation starts is the most important factor in model performance. Ambiguous labelling standards produce ambiguous models. Models are trained to generalise across lighting condition variation, product colour and size variants, and orientation differences on the line. Confidence-scored detection with configurable threshold setting lets your quality team balance sensitivity (catching more defects) against specificity (reducing false rejections) based on the cost of a false positive versus the cost of a defect escaping to the customer. The Type I / Type II error tradeoff is calibrated against your quality cost model during threshold tuning rather than set arbitrarily.
Camera and lighting system design for your specific inspection task. GigE Vision cameras from Basler or Allied Vision are standard for industrial line inspection. GigE Vision is the machine vision protocol that covers camera control, image acquisition, and data transfer over standard Ethernet, allowing deterministic frame triggering at production line speed without the latency variability of USB cameras. Basler ace and pulse series and Allied Vision Alvium series are commonly used for inline inspection at line speeds from 100 to 600 units per minute, depending on lens, resolution, and shutter speed selection. Lighting configuration, whether diffuse dome for surface defect detection, telecentric backlight for dimensional measurement, or coaxial illumination for reflective surfaces, is specified during hardware scoping based on the defect types and product geometry.
Inference runs on an NVIDIA Jetson Orin edge module for installations requiring on-premise processing without a server room, or on a rack-mounted GPU inference server for higher throughput or multi-camera installations. The ONNX runtime and TensorRT optimisation pipeline converts the trained model to a TensorRT engine optimised for the target GPU, reducing inference latency to 10-30ms per image on Jetson Orin for typical detection models. OpenCV handles image preprocessing: adaptive thresholding, morphological operations to separate connected defect regions, and normalisation before inference. Integration with production line PLCs via digital I/O or OPC UA protocol outputs a rejection signal to trigger the reject gate, air blower, or diverter mechanism within the inter-unit gap, removing the defective unit from the line without stopping throughput.
Classification models that distinguish defect types, not just defect presence. A binary pass/fail model tells you a defect was found. A classification model tells you it was a surface scratch, not a dimensional failure, and that matters because the corrective actions are different: a scratch may trace to a handling issue at a specific production stage, while a dimensional failure traces to tooling wear or a machine calibration drift. YOLOv8 classification heads or separate EfficientNet-B4 classifiers are trained per defect category using bounding-box annotated images from CVAT or Label Studio, with each defect type as a separate class.
Severity grading within defect types adds a second dimension to the classification. A minor surface mark that is cosmetic-only gets a different disposition than a major surface defect that affects sealing or structural integrity. Severity grades are defined by your quality engineering team and encoded in the labelling standard before annotation. The model learns to map visual features to severity grades based on that standard. Every rejection is captured with: defect class label, severity grade, confidence score, bounding box coordinates on the inspection image, a cropped image of the detected defect region, timestamp, production line, and shift. This image archive is stored in S3 (or equivalent object storage) with structured metadata indexed for retrieval by query. The indexed archive is the dataset for model retraining: as production conditions change and new defect types emerge, the archive provides the foundation for iterative model improvement without rebuilding the dataset from scratch.
Real-time defect rate data fed into your Statistical Process Control system as each inspection event is generated. SPC integration sends structured inspection results, including defect count, defect type, production line, timestamp, and SKU, to your SPC platform via API (InfinityQS, Minitab Workspace, or custom SPC systems) or a direct data stream to the SPC database. This replaces the end-of-shift manual tally sheet as the data source for SPC charts, giving your quality engineers live control chart data rather than a picture of what happened eight hours ago.
Defect rate P-charts and NP-charts by defect type, production line, shift, and SKU update in real time as the inspection generates data. When a data point crosses a control limit (typically set at three sigma from the mean), an alert is triggered to the quality engineer and line supervisor before the next inspection cycle, not at the next scheduled quality review. Process capability metrics (Cpk, Ppk) calculated from the inspection measurement data identify which lines and SKUs are most at risk of producing out-of-spec product. SPC trend detection using Western Electric rules flags systematic process drift before a control limit is crossed. The SPC integration also feeds the CMMS: a sustained increase in a defect type associated with tooling wear or machine degradation triggers a preventive maintenance work order automatically, rather than waiting for a quality hold to prompt the investigation.
Rejection management workflows triggered automatically when the inspection system classifies a unit as a reject. The rejection event creates a record with defect class, severity grade, confidence score, and inspection image, and simultaneously sends a signal to the line PLC to divert or eject the unit. Downstream from the line, the rejected unit is tracked through your WMS or ERP using the serial or batch number captured at inspection: rework routing sends correctable defects to the rework station with the defect description and corrective procedure attached; scrap classification sends non-correctable defects directly to scrap with a disposal record. Rework completion is recorded against the original rejection so the rework conversion rate is tracked over time.
Rejection reason codes are automatically populated from the defect classification model output and mapped to your ERP's quality notification reason codes. The quality notification in SAP QM or the nonconformance record in your QMS is created from the inspection data without manual entry. Shift-end rejection summary reports are generated automatically: total units inspected, total rejects by defect type, rejection rate by line and SKU, top three defect causes by frequency. Quality hold workflows trigger when a batch's cumulative rejection rate exceeds a defined threshold. The batch is flagged for hold in the WMS, the quality manager is notified, and a hold disposition workflow starts that requires a quality decision before the batch moves to the next production stage. The false positive rate is tracked separately: units flagged by the system as rejects but confirmed as acceptable on secondary review feed a false positive metric that is monitored alongside true reject rate, because an excessive false positive rate drives line downtime and rework cost that partially offsets the defect escape savings.
Quality analytics dashboards built for two audiences with different data needs. Production-floor dashboards display real-time inspection status: units inspected in the current shift, current defect rate versus target, top defect type in the current run, and a live feed of the most recent rejection images. Management dashboards aggregate across lines, shifts, SKUs, and time periods: first-pass yield trends, defect rate by line and shift, top defect causes ranked by frequency and cost impact, and comparison across production lines to identify which equipment or process generates the most quality risk.
Correlation analysis between production parameters and defect rates is built into the analytics layer: machine speed, die temperature, raw material lot number, and operator shift are stored alongside each inspection event so the data team can query whether defect rate increased when lot 4472 was introduced, or whether Line 3 consistently produces more surface scratches on the night shift. This correlation data is what drives root cause analysis from hypothesis to evidence. Pareto charts of defect causes, ranked by frequency and by downstream quality cost (escape cost, rework cost, customer return cost), prioritise which corrective actions to invest in first. The defect image archive in S3, with metadata indexing by defect class, severity, line, SKU, date, and production parameters, supports model retraining. When a new defect type appears in production, the quality team uses Label Studio to annotate examples from the archive and the model is retrained on the augmented dataset without rebuilding the annotation infrastructure.
For well-defined, trained defect categories, AI visual inspection using YOLOv8 or EfficientNet-B4 models typically achieves 95-99% detection accuracy when trained on a representative labelled dataset of 500-2,000 images per defect class. Human visual inspection accuracy under controlled, focused conditions is typically 80-95% for simple defect types and lower for complex or subtle defects, particularly after extended shift lengths where concentration degrades.
The more practically important comparison is consistency: AI inspection accuracy doesn't degrade over time within a shift. Hour eight looks the same as hour one. On a three-shift production operation running six days a week, the consistency advantage compounds significantly. False positive rate, the proportion of units rejected by the model that are actually acceptable, is the second critical metric alongside detection accuracy, because excessive false positives drive rework cost and line downtime. False positive rate calibration against your quality cost model is part of threshold tuning. Accuracy on defect categories the model hasn't been trained on is poor. The model outputs a low-confidence score for unknowns rather than correctly identifying them. AI quality control isn't a general-purpose inspection system. It's a model trained specifically on your product, your defect taxonomy, and your quality standard.
A minimum viable dataset for training a defect detection model typically requires 500-2,000 images per defect category, captured under production conditions: the actual inspection lighting setup, the actual camera angle, and a representative range of product variants and colour batches. Pass images (no defect present) are also needed in proportion, typically 2-3 pass images per fail image, so the model learns to distinguish defect from normal variation rather than treating every surface feature as a defect candidate.
Labelled images require annotation using a tool such as CVAT or Label Studio: bounding box coordinates around each defect instance with the defect class label for object detection models, or image-level class labels for classification models. We work with your quality engineering team to define the labelling standard before annotation starts: what constitutes each defect class, what the severity threshold is for reject versus accept, and how to handle borderline cases. This labelling standard is documented and applied consistently so the model learns your quality criteria, not a loosely defined approximation of them.
For products with rare defect types, data augmentation (geometric transforms, lighting variation, synthetic defect overlay) addresses class imbalance. For new production lines with no historical defect image library, we design a structured data collection phase: a defined number of production runs with images saved from the inspection station before model development begins. The data collection phase duration is estimated from your defect occurrence rate and the minimum dataset size required for the target accuracy level.
Not if the inspection system is designed for your line speed from the start. Inspection cycle time is determined by three factors: camera shutter speed and triggering latency, image resolution and transfer time over GigE Vision, and inference time on the GPU. TensorRT-optimised models running on NVIDIA Jetson Orin process a typical 5-megapixel inspection image in 15-40ms including preprocessing with OpenCV. At 40ms per image, the system can inspect up to 25 units per second (1,500 per minute) at a single inspection point with a single camera, which covers the majority of discrete product manufacturing lines.
For high-speed lines above 600 units per minute, multi-camera inspection arrays with parallel TensorRT inference on separate GPU streams are designed so each camera covers a portion of the throughput. Line speed in units per minute, unit dimensions, conveyor pitch, and the number of inspection faces required (top-only, top and bottom, 360-degree) are all captured during hardware scoping. The inspection system is designed to fit within the inter-unit gap at your production speed without requiring a line reduction. A throughput impact during inspection is a design failure, not an acceptable tradeoff. If your line speed genuinely exceeds what a single inspection point can cover, we design the station layout before development starts so the hardware requirement and footprint are known before any code is written.
Yes. The inspection system outputs structured defect data, including defect class, severity, confidence score, unit identifier, timestamp, line, and shift, in a format that integrates with your existing QMS and ERP. We connect to SAP QM via the SAP BAPI or RFC interface, Oracle Quality via REST API, and MES platforms (Siemens Opcenter, Rockwell FactoryTalk, custom MES) via API or OPC UA. Quality notification creation in SAP QM is triggered automatically when a defect is detected: the notification is populated with the defect code, production order reference, quantity, and inspection image without manual entry. Production order records are updated with actual versus expected quality results. Defect data flows to your SPC system (InfinityQS, Minitab Workspace, custom SPC) for real-time control chart updates.
CMMS integration (IBM Maximo, SAP PM, or custom CMMS) allows defect-triggered maintenance work orders: a sustained increase in a defect type associated with tooling wear or equipment degradation creates a preventive maintenance work order automatically rather than waiting for a quality hold to prompt the investigation. Defect images are archived in S3 or Azure Blob Storage with structured metadata for indexing and retrieval, supporting both quality analysis queries and model retraining workflows. We scope the integration requirements during discovery, covering the specific QMS and ERP systems, the API or interface method available, and the data mapping between inspection output and the destination system's data model, and confirm connectivity and mapping before development starts so the integration scope and cost are accurate.
What clients say
Three-year average engagement. Founders and operators describing the work in their own words. No marketing varnish.

 Indonesia
I definitely recommend RaftLabs, especially to founders building complex platforms. They were transparent throughout the whole project.
01 / 02
Tell us your inspection line speed, current defect types, and what your defect escape rate costs you. We will design the AI inspection system and give you a fixed cost.