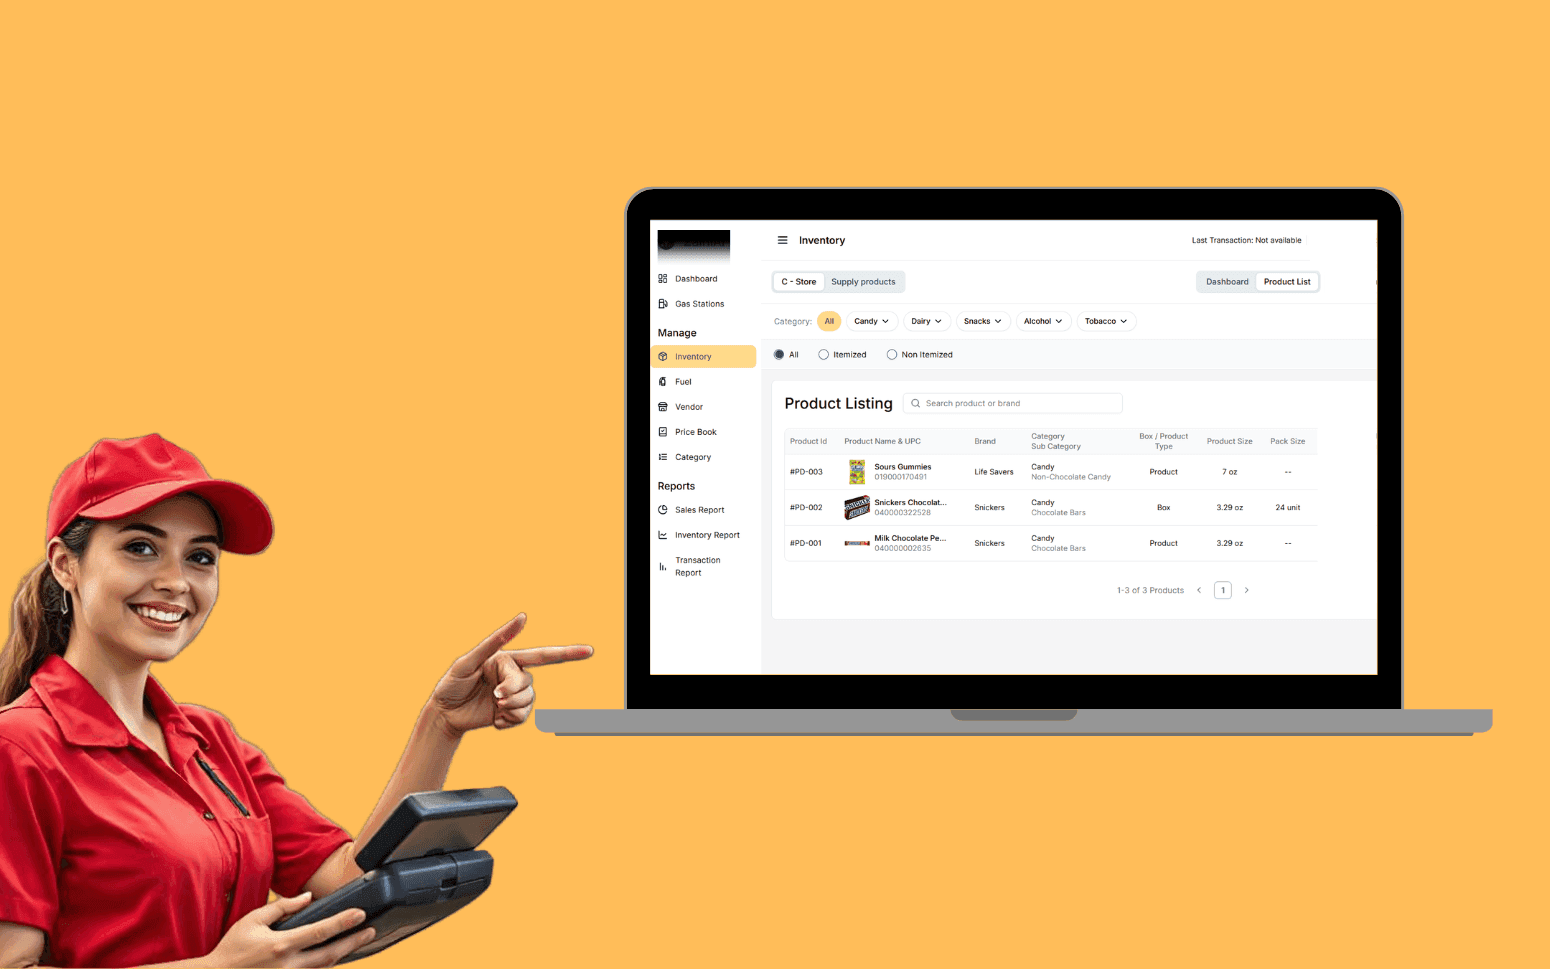
AI OCR Software Scales Gas Station Operations With 20K+ Transactions
- 20K+
- 40+
- 70%
Equipment failure prediction from your sensor data, vibration, temperature, pressure, power draw, and cycle time deviation, with maintenance recommendations integrated into your CMMS before the breakdown happens.
The shift from calendar-based to condition-based maintenance that reduces unplanned downtime without over-servicing.
Failure prediction models trained on your equipment sensor data and historical maintenance records
Real-time anomaly detection on process parameters with early warning alerts
Maintenance schedule recommendations integrated with your CMMS for automated work order creation
Remaining useful life estimation for critical equipment components
Recognition
Unplanned equipment downtime costing more per hour than the annual maintenance budget for that machine?
Calendar-based maintenance servicing equipment that doesn't need it while missing failures between service intervals?
In short
RaftLabs builds predictive maintenance software for manufacturing operations, equipment failure prediction from sensor data (vibration, temperature, pressure, power draw), anomaly detection on process parameters, and maintenance schedule recommendations integrated with your CMMS or ERP. Predictive maintenance shifts equipment servicing from calendar-based to condition-based, reducing unplanned downtime by 20-40% without over-servicing. Most predictive maintenance projects deliver in 10-14 weeks at a fixed cost.
Companies we've built for








Unplanned downtime costs more per hour than planned maintenance, typically 5-10x more when you factor in emergency labour rates, expedited parts, production losses, and secondary damage from running failed equipment. Calendar-based maintenance reduces surprise failures but replaces components that still have useful life, adding cost without eliminating downtime.
Predictive maintenance uses the sensor data your equipment already generates to identify degradation patterns before failure. The maintenance happens when the equipment needs it, not on a fixed schedule. The failure doesn't happen at all.
Machine learning models trained on your historical sensor data and failure records to predict equipment failures before they occur. Vibration signature analysis, temperature trend modelling, power consumption anomaly detection, and cycle time degradation patterns: models trained on your specific equipment types, operating conditions, and failure modes rather than generalised benchmarks.
The feature engineering layer processes raw sensor signals into predictive features. FFT (Fast Fourier Transform) spectra from vibration accelerometers capture bearing fault frequencies at the BPFI (ball pass frequency inner raceway), BPFO (ball pass frequency outer raceway), BSF (ball spin frequency), and FTF (fundamental train frequency). These are the four bearing fault frequencies that manifest earliest in the vibration spectrum, typically 4-8 weeks before audible failure symptoms. Sensors from Brüel & Kjær or PCB Piezotronics operating in the 1-10 kHz range provide the frequency resolution needed for this analysis.
The predictive models use gradient boosted tree algorithms, XGBoost and LightGBM, which handle the tabular time-series feature matrices well and train on modest historical datasets. SHAP (SHapley Additive exPlanations) feature importance analysis is applied to every model so your engineering team can see which specific sensor signals and frequency bands are driving each prediction. Confidence-scored predictions with lead time estimates tell your maintenance team how urgently to act: not just whether a failure is coming, but approximately when.
Real-time monitoring dashboards for equipment health across your plant. Sensor data ingested from PLCs, SCADA systems, and IoT edge devices via OPC-UA, Modbus TCP, or MQTT depending on what each piece of equipment exposes. OPC-UA is preferred where available because it provides structured, typed data with equipment metadata rather than raw register values that require manual mapping.
Raw sensor signals are pre-processed at the edge or ingestion layer to remove noise before storage and analysis. A Kalman filter denoising step handles the sensor noise and transient spikes that characterise vibration and pressure signals in production environments. Without this step, ML models and threshold alerts generate excessive false positives that erode maintenance team trust in the system within weeks.
The monitoring dashboard provides current condition scores, trend visualisations, and anomaly flags at both machine level and fleet level. Alert configuration covers different severity thresholds: informational (trend to watch), warning (schedule maintenance soon), and critical (immediate action required), with configurable escalation routing by equipment criticality and shift.
Component-level remaining useful life (RUL) estimation for critical parts: bearings, seals, drives, cutting tools, and wear components. Estimates are based on current condition trends rather than elapsed calendar time. That's the fundamental distinction between predictive and preventive maintenance.
RUL models use Weibull distribution fitting on your historical failure records to characterise the failure time distribution for each component type. The current sensor signature is then used as a condition variable within the Weibull model to produce a probabilistic RUL estimate. Not a single number, but a confidence interval that tells the maintenance team the range within which failure is likely. For bearings, the FFT-derived fault frequency amplitudes provide the most reliable RUL signal. For drives and motors, power consumption trending against baseline is typically the primary indicator.
Replacement scheduling recommendations target replacement at 85-90% of estimated life to preserve reliability margin without the waste of replacing components with 40% life remaining on a calendar schedule. Integration with your parts inventory and procurement system via API connections to SAP MM or equivalent triggers automated reorder when RUL thresholds are reached so parts are available when the maintenance window arrives rather than ordered in response to an unplanned failure. The shift from fixed replacement intervals to data-driven component management typically extends average component life by 15-30%.
Automated work order creation in your CMMS when predictive models flag maintenance requirements. We integrate with IBM Maximo via the Maximo Application Framework REST API, SAP PM via BAPI and IDoc interfaces, eMaint and UpKeep via REST APIs, and Infor EAM via its standard web services layer. For custom or legacy CMMS platforms, we use database-level integration or file-based import where API access is limited.
Each work order created by the predictive system includes: equipment identifier and location, failure mode predicted, confidence score, supporting sensor data and trend chart, suggested maintenance action based on the fault classification, and required parts based on the component identified. The maintenance technician arriving at the machine has actionable context rather than a generic "check equipment" work order.
Post-maintenance data capture closes the feedback loop. The technician records what was actually found and what was done, which feeds back into the prediction model training pipeline. The system learns from cases where it predicted correctly, cases where it predicted early, and cases where the predicted failure mode differed from what was found. This closed loop between condition data and maintenance execution is what allows the model to improve accuracy over the 6-18 months following deployment, per McKinsey benchmark data showing 10-40% maintenance cost reduction at mature implementations.
Data ingestion pipelines for high-frequency sensor data from existing equipment instrumentation. OPC-UA is the preferred industrial protocol. It provides structured, self-describing data with equipment hierarchy metadata and supports both polling and subscription models. Where equipment exposes only Modbus RTU/TCP or raw PLC registers, we build an OPC-UA server layer that maps the registers to structured data types before they enter the analytics pipeline.
For vibration analysis applications, sensors from Brüel & Kjær or PCB Piezotronics operating in the 1-10 kHz range are specified during discovery if existing sensors don't cover the required frequency range for bearing fault detection. IEPE (Integrated Electronics Piezo-Electric) sensors with a compatible data acquisition module are the standard specification. High-frequency samples (typically 25.6 kHz sampling rate) are processed at the edge to FFT spectra before transmission to reduce bandwidth requirements. Sending spectra rather than raw time-series data reduces data volume by 100x or more.
Time-series data is stored in a purpose-built time-series database (InfluxDB or TimescaleDB) optimised for the write throughput and range query patterns that sensor analytics requires. Data quality monitoring on the pipeline itself flags sensor faults, because a vibration sensor reading a flat 0g signal is either a machine that stopped or a sensor that failed, and both require different responses.
Statistical and ML-based anomaly detection on process parameters for detecting novel failure modes that haven't appeared in your historical failure records. Unsupervised learning approaches: isolation forests, variational autoencoders, and LSTM-based reconstruction error, identify unexpected patterns without requiring labelled failure examples. This matters because new failure modes do appear in production environments, especially after equipment modifications, process changes, or material substitutions. A purely supervised model has no ability to flag them.
The anomaly detection layer runs alongside the supervised failure prediction models. Supervised models handle known failure modes with high specificity. The unsupervised anomaly detector provides broader coverage and catches edge cases that fall outside the training distribution. Early warning alerts surface process parameter deviations before they reach failure thresholds, typically catching anomalies 3-14 days before a threshold-based alarm would fire, depending on the degradation rate.
Root cause analysis assistance correlates anomalies across sensors to identify likely failure mechanisms. When a combination of elevated motor current draw, increased bearing vibration amplitude, and rising gearbox temperature appear together, the correlation analysis surfaces all three signals simultaneously rather than generating three separate alerts that a technician has to manually connect. Kalman filter-based signal processing removes noise from individual sensor streams before they enter the anomaly detector, reducing false positive rates to a level the maintenance team can sustain without alert fatigue.
The minimum requirement is time-series sensor data from the equipment you want to monitor, plus historical records of failures and maintenance actions. Common sensors include vibration accelerometers (typically IEPE type, 1-10 kHz range for bearing fault detection), temperature sensors (thermocouples or RTDs), pressure transducers, power consumption meters (CT clamp sensors or smart energy meters), and cycle time data from the PLC.
Most modern equipment generates this data via PLC or built-in instrumentation, accessible via OPC-UA or Modbus. The challenge is usually accessing and centralising the data rather than generating it. PLCs may not expose all sensor channels via their network interface, or historical data may be stored in a historian like OSIsoft PI with limited retention periods.
For older equipment without built-in instrumentation, we specify the sensor additions required during discovery. A typical retrofit for a motor-driven machine adds an IEPE vibration sensor on the bearing housing, a current transformer on the motor supply circuit, and a temperature sensor on the gearbox housing, often at a hardware cost of $500-$2,000 per machine. We assess your existing sensor coverage during discovery and design the system around what data is available and what additions are justified by equipment criticality.
The more failure examples in the historical data, the more accurate the supervised prediction model. As a practical minimum, we look for 12-24 months of sensor data with at least 5-10 failure events for each failure mode we're predicting. Below this threshold, the supervised model can't reliably learn the failure signature distinct from normal operating variation.
For equipment with rare failures or new installations, we use three complementary approaches: transfer learning from pre-trained models built on similar equipment types (reducing the failure example requirement substantially), physics-based degradation modelling of known failure mechanisms (for example, Palmgren-Miner rule for fatigue-based failures), and unsupervised anomaly detection that doesn't require failure examples at all. The unsupervised approach detects when operating conditions deviate from the historical normal without requiring labelled failure data.
Where historical data exists in a CMMS like Maximo or SAP PM but hasn't been linked to sensor data, we perform a data linkage exercise during discovery. This involves matching maintenance work order timestamps to the sensor historian to label periods preceding known failures. This retrospective labelling exercise can substantially increase the effective failure example count from what appears to be sparse data. We assess data availability during scoping and design the technical approach based on what's actually available.
ROI from predictive maintenance comes from three sources: avoided unplanned downtime, reduced maintenance labour costs, and extended equipment life. McKinsey's manufacturing benchmark data cites 10-40% maintenance cost reduction and 20-50% reduction in machine downtime as the achievable range for mature predictive maintenance implementations.
Avoided unplanned downtime is typically the largest contributor. For high-throughput production lines, downtime costs $5,000-$50,000 per hour when production losses, emergency labour, expedited parts, and secondary damage from running failed equipment are included. A predictive system that prevents four unplanned stoppages per year on a line with $15,000/hour downtime cost produces $60,000 in direct annual value before accounting for maintenance labour savings.
Condition-based scheduling reduces unnecessary preventive maintenance work by 20-30%. When every component is serviced at its actual condition rather than a fixed calendar interval, total maintenance labour hours and parts consumption fall substantially. Extended component life from early intervention, stopping a bearing from running to catastrophic failure rather than to audible noise, typically adds 20-40% to average component service life. We model expected ROI during scoping based on your specific downtime cost per hour, current unplanned downtime frequency, and annual maintenance spend. We don't apply generalised benchmarks as substitutes for your actual situation.
A focused system monitoring one equipment type or production line, including sensor data pipeline, model development, condition monitoring dashboard, and CMMS work order integration, typically delivers in 10-14 weeks. This breaks down approximately as: discovery and sensor assessment (weeks 1-2), data pipeline and sensor integration (weeks 2-5), model development and validation (weeks 4-9), dashboard and CMMS integration build (weeks 7-12), and user acceptance testing and go-live (weeks 12-14).
More complex builds covering multiple equipment types, multi-site deployment, or significant sensor hardware retrofit work run 16-24 weeks. The primary timeline drivers are sensor infrastructure (installing new sensors and running signal cables on production equipment requires planned downtime windows), CMMS API integration complexity (IBM Maximo customised instances and SAP PM configurations vary significantly across organisations), and model validation time (rigorous validation against held-out failure events before production deployment).
We scope the project before pricing it. You know the timeline, the delivery milestones, and the fixed cost before development starts. Sensor hardware procurement is typically scoped separately from software development so you can obtain quotes and plan installation windows in parallel with the software build.
What clients say
Three-year average engagement. Founders and operators describing the work in their own words. No marketing varnish.

 Indonesia
I definitely recommend RaftLabs, especially to founders building complex platforms. They were transparent throughout the whole project.
01 / 02
Tell us your equipment types, current sensor infrastructure, and what downtime is costing you. We'll design the system and give you a fixed cost.