CRM ERP Workflow Integration
CRM ERP workflow integration that ends the second entry.
A won deal should not become an email asking operations to create the same order again. RaftLabs connects CRM and ERP systems so customer, order, fulfilment, invoice, and payment updates move at the business event that creates them, with validation and recovery when either system is unavailable.
Bring the problem, the current workflow, or the existing code. We reply with a practical next step within one business day.
The brief
Start with what is not working.
Good software decisions begin with the constraint, not a list of features or a preferred technology.
01
Does a closed deal still need someone to re-enter customer, product, or pricing data in the ERP?
02
Can sales see fulfilment and payment status without opening the ERP or asking another team?
Plain answer
CRM ERP workflow integration moves customer, order, invoice, and payment data between sales and operations systems. RaftLabs creates monitored links with clear ownership, safe retries, and reconciliation. A focused deal-to-order flow starts at $15,000 and usually takes 6 to 10 weeks.
The deal closed once. Why is operations entering it again?
Sales marks the deal won. An email asks operations to create the order. A field is missing, the product code differs, and the requested delivery address is no longer current. The customer sees a delay created after the sale was already complete.
CRM ERP workflow integration removes that second entry. It validates the handoff, creates the operating record, and returns the ERP identifier to the deal. Later phases can bring fulfilment, invoices, and payment status back to the people handling the customer.
Adjacent integration proof
- order errors reported after three food-order channels fed one operating flow
- 0%
- RaftLabs Gula project record
- carrier integrations recovered inside one shipping product
- 5
- FedEx, DHL, UPS, Aramex, and Shippo
- existing shipping accounts moved without service disruption
- 200+
- Client-reported UrShipper outcome
The public case studies above prove cross-system integration work, not a published CRM-to-ERP deployment. This page does not turn adjacent evidence into a claim that those clients used the exact quote-to-cash scope described here.
Custom CRM ERP integration pays off when the business rules outgrow a connector.
Use the native or iPaaS connector when it can move the right data and recover cleanly.
A fit
01
The handoff carries enough order or revenue volume that re-entry and delay have a measurable cost.
02
Products, pricing, accounts, or statuses need rules that a standard connector cannot express.
03
The integration needs dependable retries, duplicate prevention, reconciliation, and an operating queue.
Not a fit
01
A supported native connector already covers the fields and direction you need.
02
Neither team has agreed which system owns each disputed field.
03
The source data is too inconsistent to validate an automated order safely.
Scope
What the quote-to-cash connection can cover
- 01
Deal to order
A won deal triggers validation before the ERP receives it. Required account, product, price, tax, and delivery fields must pass the agreed rules. The ERP order number returns to the CRM so both teams refer to the same operating record. - 02
Fulfilment and delivery status
Picking, dispatch, delivery, or exception updates can appear on the CRM account or deal timeline. Sales and customer teams see the operating status without an ERP login or another message to operations. - 03
Invoice and payment visibility
Invoice number, amount, due date, and payment status can return to the CRM. An overdue item can create a task for the account owner while finance keeps the ERP as the source of truth. - 04
Account, product, and pricing rules
The integration follows explicit ownership by field. It can detect duplicate accounts, translate identifiers, pull current ERP prices for a quote, and stop a conflicting update instead of choosing a winner silently.
iPaaS connector or custom CRM ERP integration?
The choice is about operating control, not software fashion. Keep the integration on a platform you already run when it can handle the route.
iPaaS vs custom integration
| Existing iPaaS | Custom middleware | |
|---|---|---|
| Best fit | Both platforms have maintained connectors | A connector is missing or the route has unusual rules |
| Mapping | Configuration inside the platform | Code and controls limited to your exact data model |
| Recovery | Uses the platform's retry and queue features | Recovery and reconciliation follow your operating process |
| Ownership | Your team runs the platform and its licences | You own the service and its hosting |
| Good decision | Extend what already works | Add control only where the platform creates a real constraint |
How it works
How a CRM ERP integration project runs
Fix one costly direction first, then close the loop.
- Phase 101
Choose the first business event
Start with the handoff causing the most re-entry, usually a won deal creating an ERP order. Record the current delay, error types, and people involved.
- Phase 202
Set ownership and mapping
Decide which system owns each field and how statuses, products, accounts, and identifiers translate. Unresolved ownership stays out of the automated route until the teams agree.
- Phase 303
Test failure and recovery
Prove duplicate prevention, retry behavior, reconciliation, and operating alerts before the integration carries live orders. Test invalid records and downtime, not only correct payloads.
- Phase 404
Add the return path
Bring fulfilment, invoice, or payment status back into the CRM after the first direction is dependable. Each later event gets its own owner and success measure.
The failures that matter after launch
- Duplicate orders
- A repeated deal-won event must return the first result instead of creating another ERP order.
- Conflicting field ownership
- Two-way sync needs a named source for each field. Updated-at time alone is not a business rule.
- Dropped events
- A scheduled reconciliation should compare important records so a missed webhook does not become a permanent gap.
- An engineering-only error queue
- Operations needs the failed record, reason, and safe retry route without waiting for a developer.
Proof
Adjacent integration work
Carrier and Shopify integration recovery for UrShipper

GE gets 85% quiz completion and 5,000 daily active users by replacing passive training with a mobile trivia platform
GE replaced passive corporate training with a gamified mobile trivia platform. 5,000 daily active users, 85% quiz completion rate, and 200+ content modules covering product knowledge, company history, and culture.
Scope and price
A deal-to-order workflow starts at $15,000.
Begin with one direction, the core field map, an error queue, and reconciliation. Add the return path after live orders move cleanly.
A wider quote-to-cash integration can grow toward $60,000 as fulfilment, invoice, payment, product, and account flows are added in phases.
Starting investment
Starts at $15,000
A focused first direction usually takes 6 to 10 weeks. Platform access, field ownership, validation, and recovery rules are agreed before development starts.
Fixed-price phase
Once the first direction is scoped, its price is locked in writing. A new object, field family, or return path is priced before it enters the work.
Post-launch support
Eight weeks of support are included so live mapping errors, queue behavior, and reconciliation gaps can be corrected after go-live.
Useful next steps
More on integrations & APIs
Work with us
Work with us
AI Voice Agent Development Services
See the serviceTry it yourself
Try it yourself
Automation ROI Calculator
Find out what your manual processes cost, and what automation saves.
Open the free tool
Article
Cost to Build a Trading App Like Robinhood: Features and What Fintech Founders Need
Trading app development cost, phased feature breakdown, clone vs. custom build comparison, and how RaftLabs builds commission-free investment platforms for fintech startups.
Read more
Article
Nonprofit CRM and Fundraising Platform Development: Build Your Own Donor Portal
A nonprofit raising $1M/year pays Donorbox $15,000 in platform fees. A hospital foundation at $5M/year pays $18,000 and still does not own its donor data. Here is what custom nonprofit fundraising platform development costs, what you get, and when it makes financial sense.
Read more
Article
How to Build a Travel Booking Platform Like Expedia (For Niche Operators)
Adventure travel operators, corporate travel managers, and regional tour packagers don't need to compete with Expedia globally. They need a vertical OTA that fits their inventory and audience. Here is what building one actually costs, what fails, and when custom beats white-label.
Read more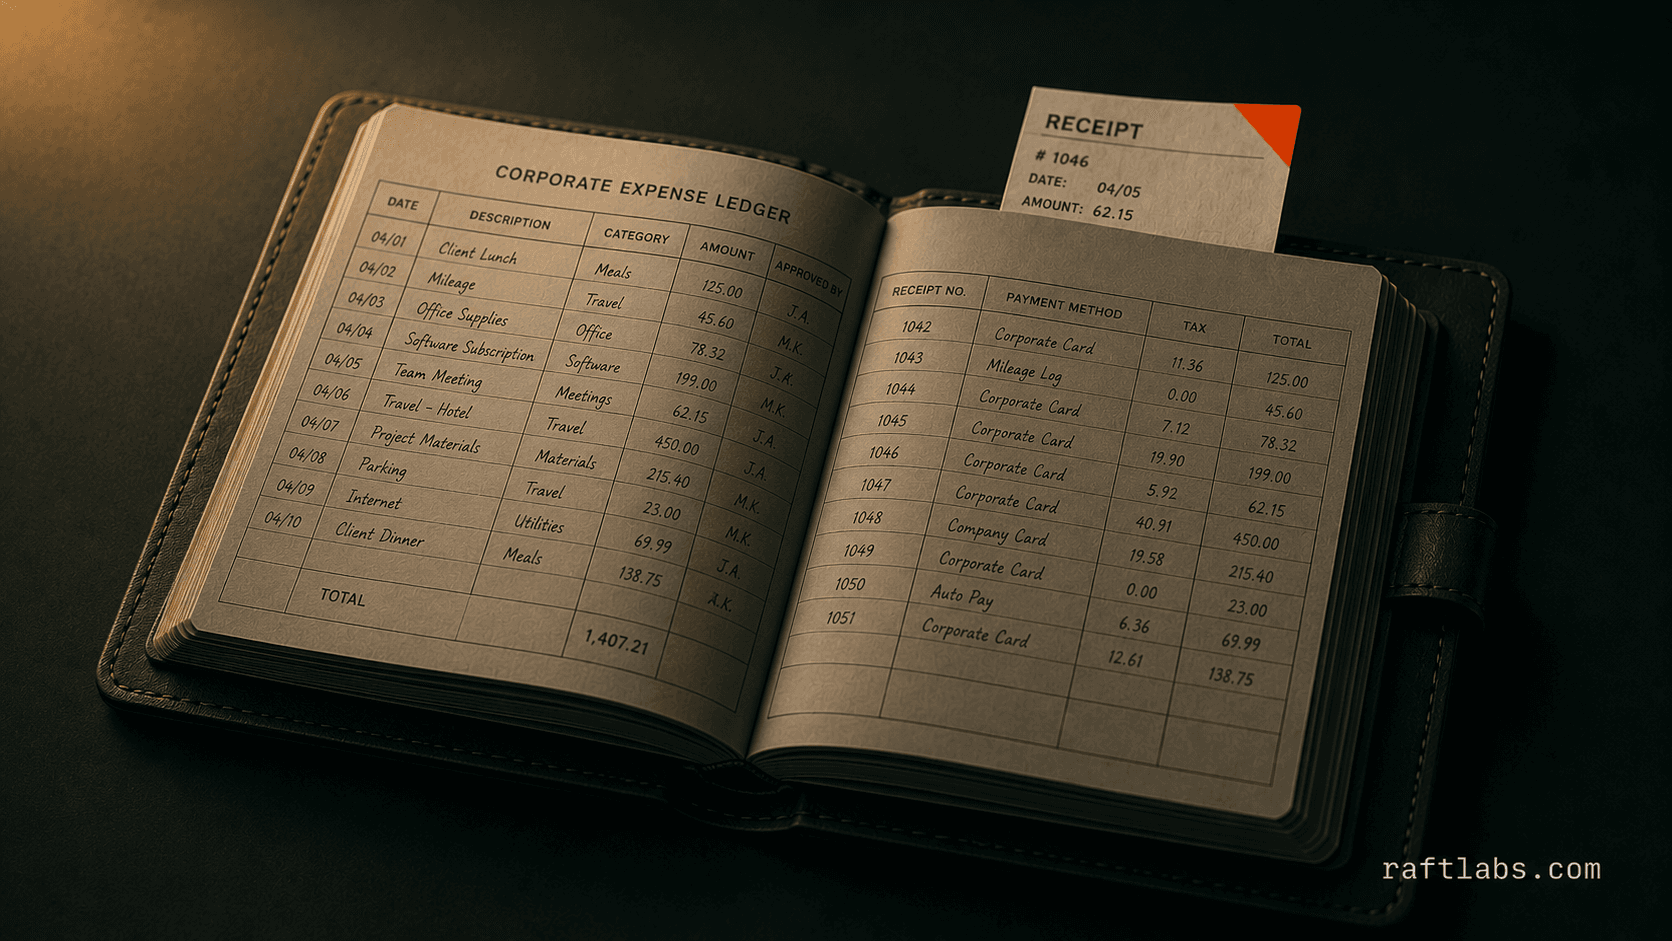
Article
Expense Management Software Development: Build vs. Buy Guide for Business Operators
Custom expense management software development costs $120K-$280K and takes 12-24 weeks. Here's when Expensify, Concur, and Ramp stop working for your business, what to build instead, and what it actually costs by phase.
Read moreCommon questions
CRM ERP workflow integration moves sales data into the operating system and returns fulfilment or finance updates to the CRM. A common first route turns a won deal into an ERP order, then writes the ERP order number back to the deal without manual re-entry.
Ownership should be decided field by field. The ERP commonly owns product, stock, tax, invoice, and payment data. The CRM often owns relationship and opportunity data. Customer fields need an explicit master and conflict rule so a two-way sync does not overwrite a valid change.
Use an existing iPaaS such as MuleSoft, Boomi, or Workato when it supports both systems and your mapping and recovery needs fit its model. Custom middleware is useful when the route needs unusual validation, strict sequencing, deeper reconciliation, or an older system without a dependable connector.
A focused deal-to-order workflow with core field mapping, an error queue, and reconciliation starts around $15,000. A wider quote-to-cash integration can grow toward $60,000 as fulfilment, invoice, payment, product, or account sync is added.
A focused first direction usually takes 6 to 10 weeks. A broader two-way quote-to-cash integration often takes 10 to 16 weeks. API quality, field mapping, historical data cleanup, test access, and the number of ERP business rules affect the timeline.
Work with us
Show us where CRM data gets entered twice.
Bring the two platforms, the first business event, and the fields your team copies today. We will map system ownership and price the smallest useful integration.
- Scope and cost agreed before work starts. No surprises. No obligation.
- Working prototype within 3 weeks of kickoff.
- Pay by milestone. You see progress before each invoice.
- 60-day post-launch warranty. Bug fixes, UI tweaks, and deployment support. No retainer.
- All conversations are NDA-protected.