Multi-platform order management for a food SaaS
- 0%
- order errors since launch
Workflows break down at the handoff points: the email that was supposed to trigger an action, the approval that sat in someone's inbox, the data that needed to move from one system to another and didn't.
We do not redesign your business processes. We map the process your team already runs, then automate the manual, repetitive, error-prone steps inside it, so the same process runs faster and with fewer mistakes. We build automated systems that connect your tools, apply your business rules, and route work to the right person at the right time, without manual coordination.
API-based integrations connecting CRM, ERP, communication tools, and custom systems
Multi-step workflows with conditional logic, approval gates, and exception handling
Trigger-based automation from forms, emails, webhooks, and scheduled runs
Monitoring and alerting so you know when workflows fail, not when users complain
Recent outcomes
Voice AI · Research
6× deeper insights
Text-based interviews converted to automated phone calls
AI Automation · Ops
20k+ txns day one
Manual invoice OCR across 40+ gas stations
Loyalty · Retail
1,062 users in 4 weeks
SuperValu & Centra loyalty platform with receipt validation
SaaS · Logistics
2,000+ shipments yr 1
Multi-carrier shipping hub for Indonesian eCommerce
The problem
Repeatable processes that depend on someone remembering to do the next step?
Tools that should talk to each other but don't, requiring manual data transfer?
Short answer
RaftLabs builds workflow and business process automation for companies in the US, UK, Europe, Canada, and Southeast Asia. We map the process your team already runs, then automate its manual, error-prone steps: API integrations, conditional logic, and approval routing. A first workflow connecting 2-3 systems starts around $5,000; a full platform with SLA monitoring grows to $60,000.
Key takeaways
Trusted by













Proof
Every process that depends on someone remembering to do the next step has a failure rate. Emails get lost. Approvals sit idle. Data doesn't make it from one system to the next. The failure stays invisible until it creates a problem.
In McKinsey's State of AI survey (early 2024), 72% of organizations reported using AI in at least one business function, up from around 50% in prior years. McKinsey's automation research also estimates that current technology could automate about a third of the activities in roughly 60% of jobs. Most of that potential sits in operations, finance, and customer workflows, exactly where manual handoffs cause the most damage.
We see the same pattern in our own delivery, and those are the numbers we trust because we measured them. The gas-station operator we built an AI OCR pipeline for processed 20,000-plus transactions in a single day during real-world testing, with an offline-first sync utility reconciling data every 10 minutes. For UrShipper, a multi-carrier shipping platform, we moved 200-plus customer accounts onto new orchestration with zero shipment disruption.
Automated workflows fail loudly and predictably. Exceptions get flagged, retries happen automatically, and failures alert your team before they become expensive. Silent failure is the worse outcome.
Capabilities
Lead capture routed into your CRM with automatic deduplication, scoring, and owner assignment, then enrolled in outreach sequences so reps act on hot leads within minutes. Activity signals update scores and create tasks automatically, deal-stage changes trigger follow-ups and document generation, and stale-deal alerts surface pipeline risk before it becomes a missed quarter.
Multi-level approval workflows for purchase, contract, and expense sign-off with conditional routing by amount, department, or vendor category, replacing email chains where requests sit unread for days. The orchestration layer survives restarts and retries transient failures, SLA timers escalate stalled sign-offs, and every action lands in an immutable audit trail for SOX and compliance reporting.
Automated onboarding triggered by contract signing or first payment: account provisioning, CSM kickoff, document collection with reminders, and training scheduling. A status dashboard shows where each customer sits and fires escalations when a required step is missed, flagging churn risk while there's still time to intervene.
End-to-end procurement from purchase request to PO issuance: requests route to budget owners and POs generate in your ERP and email to vendors with no manual re-entry. Invoice receipt triggers a three-way match against the approved PO and goods receipt, holding mismatches for AP review, and audit logging captures every state transition with actor and timestamp.
Order-to-shipment automation: an order in your e-commerce platform triggers an inventory check, picks the optimal fulfilment location, generates a pick list and shipping label, and sends the customer a tracking notification. Service-request and field-service workflows auto-assign tickets and jobs by skill, location, availability, and SLA, with escalation when response targets are missed.
Bidirectional data sync between systems without native integrations, ending the weekly manual reconciliation: CRM and ERP contacts, inventory and storefront catalogues, support and billing status. Event-driven triggers update records immediately, conflict resolution applies last-write-wins or merge rules, and dead-letter queues capture failed sync events instead of silently dropping them.
These three terms get used interchangeably. They are not the same thing, and the distinction matters when you are deciding what to build.
Robotic Process Automation (RPA) automates tasks at the UI level, mimicking what a human does inside existing software, clicking buttons and entering data. Fast to deploy, brittle when the UI changes. Our RPA services use it for quick tactical wins, and workflow automation for the process logic underneath.
Business Process Management (BPM) is the discipline of designing, measuring, and improving processes. Software tools exist for it (process mapping, workflow engines), but BPM is the methodology, not the automation itself.
Business Process Automation (BPA) is what happens when you replace a manual process end-to-end with software: not screen-clicking, but actual system integration, business logic, and data processing. BPA can incorporate RPA as one component, but it operates at a deeper level: APIs, databases, document processing, decision engines.
When someone asks us about automation, we start with the outcome they need, not the tool category. We do not redesign the process itself; we automate the manual steps inside the process you already run. Sometimes RPA is the right answer for a quick tactical win. Usually, for anything high-volume or complex, you need automation built to your process, not a generic tool category.
The real decision is which execution layer connects your systems. Here is how the three options compare on the dimensions that decide maintenance cost.
| Dimension | API orchestration | RPA (UI bots) | AI agents |
|---|---|---|---|
| How it connects | Official APIs and webhooks | Clicks the UI like a human | APIs plus reasoning over unstructured input |
| Best for | Systems with stable APIs | Legacy apps with no API | Documents, email, and edge cases |
| Breaks when | An API contract changes | The screen layout shifts | Inputs drift far from prior data |
| Maintenance | Low, versioned integrations | High, brittle to UI updates | Medium, needs monitoring and tuning |
| Exceptions | Rule-based retries and escalation | Fails and stops | Classifies and routes with context |
The automation systems built five years ago could handle clean cases: structured forms, predictable data, stable system integrations. The exceptions went to a human queue. That is still true for some processes. What's different now is what counts as a "clean case."
Traditional automation fails when the input deviates from the template. An invoice formatted differently. An email that contains the relevant information but not in the expected fields. A document with a handwritten note in the margin.
AI automation handles these. LLMs and computer vision models can read an invoice in any format and extract the right fields. Classification models can route edge cases to the right human, with context already assembled, instead of dumping them in a generic exception queue. Over time, as you accumulate edge-case decisions, the model learns which decisions to automate too.
We have seen this play out on a real deployment. An AI validation pipeline built for a supermarket chain's receipt-scanning loyalty program started at roughly 80% accuracy and climbed to near 99% once the model was tuned against real production data. It caught edge cases a rules-only system had missed. The humans still make the hard calls, but "hard" gets redefined as the model learns from real data.
Structured inputs (database fields, form submissions, API payloads) were always automatable. The step change from modern AI is processing unstructured inputs at production scale.
Documents: invoices, contracts, medical records, compliance filings. Our intelligent document processing combines OCR, document layout models, and LLM extraction to pull structured data from any document format and validate it against your business rules before it touches a system of record.
Emails: reading supplier emails, extracting order details, flagging exceptions, routing approvals. The AI workflow automation systems we build now treat email as a structured input channel, one that your team used to process by reading and typing.
The pattern emerging now is the agentic workflow. Instead of a fixed sequence you script in advance, an AI agent plans the steps, calls the tools it needs, and adapts when a step fails. It suits work too variable to model as a rigid flowchart: a supplier query that needs three lookups and a judgment call. We build these the way we build any automation. The agent runs inside the same guardrails, with approval gates on consequential actions, idempotent tool calls, and full audit logging. An agent that can act is only safe when every action it takes is bounded and observable.
How we work
Every project follows the same four phases. Scope is locked and price is fixed before development starts.
We map your current workflow, the systems involved, and where it breaks down. You leave week 1 with a written scope document, an integration map, and a fixed-price quote. No development starts without your sign-off.
Workflow logic and exception paths defined before any code is written. Integration architecture, retry policies, and monitoring strategy locked before the build starts. Design decisions made here cost ten times less than the same decisions made in week 8.
Working automations in a staging environment by the end of sprint one. Bi-weekly demos. QA runs in parallel with every sprint, not as a phase at the end. Exception paths and failure scenarios tested before production deployment.
Production deployment with monitoring and alerting activated on launch day. 8 weeks of post-launch support included in every project. Workflow failures surface to your team, not your customers.
Why us
The engineers who assess your workflow problem also build the solution. No bait-and-switch, no offshore handoff after the contract is signed. The team you meet in week 1 ships in week 10.
We scope the work, calculate the cost, and lock it in writing before any development starts. A scope change is a change request: priced, agreed, or dropped. It never absorbs into the project and appears on the final invoice.
Clients include Vodafone, T-Mobile, Aldi, Nike, Cisco, and Lockheed Martin. Track record across AI, SaaS, mobile, automation, and enterprise platforms in healthcare, fintech, logistics, and hospitality.
GDPR, HIPAA, SOC 2 - compliance requirements are scoped in week 1, not retrofitted before launch. We have shipped HIPAA-compliant systems for US healthcare clients and GDPR-compliant products for European markets.
We define measurable success criteria before the build starts: time saved per workflow run, error rate reduction, SLA compliance. You know the ROI target before we write a line of code, not after.
Most automation projects fail on the same few problems, not on the happy path. We design for these from week one.
Tell us the current process, the systems involved, and where it breaks down. We will scope the automation and give you a fixed cost.
What clients say
Three-year average engagement. Founders and operators describing the work in their own words. No marketing varnish.

 USA
USAAll of the sprints were completed on schedule and on budget. We highly recommend RaftLabs!
01 / 02
Stay on topic

Article
AI Automation Platform Decision: When Zapier AI, Make, and Power Automate Are Not Enough
Zapier AI, Make, and Power Automate handle a lot. But operations leaders at $5M+ businesses consistently hit the same ceiling. Here is how to make the build-vs-buy call before you waste 9 months configuring a tool that was never designed for your workflow.
Read more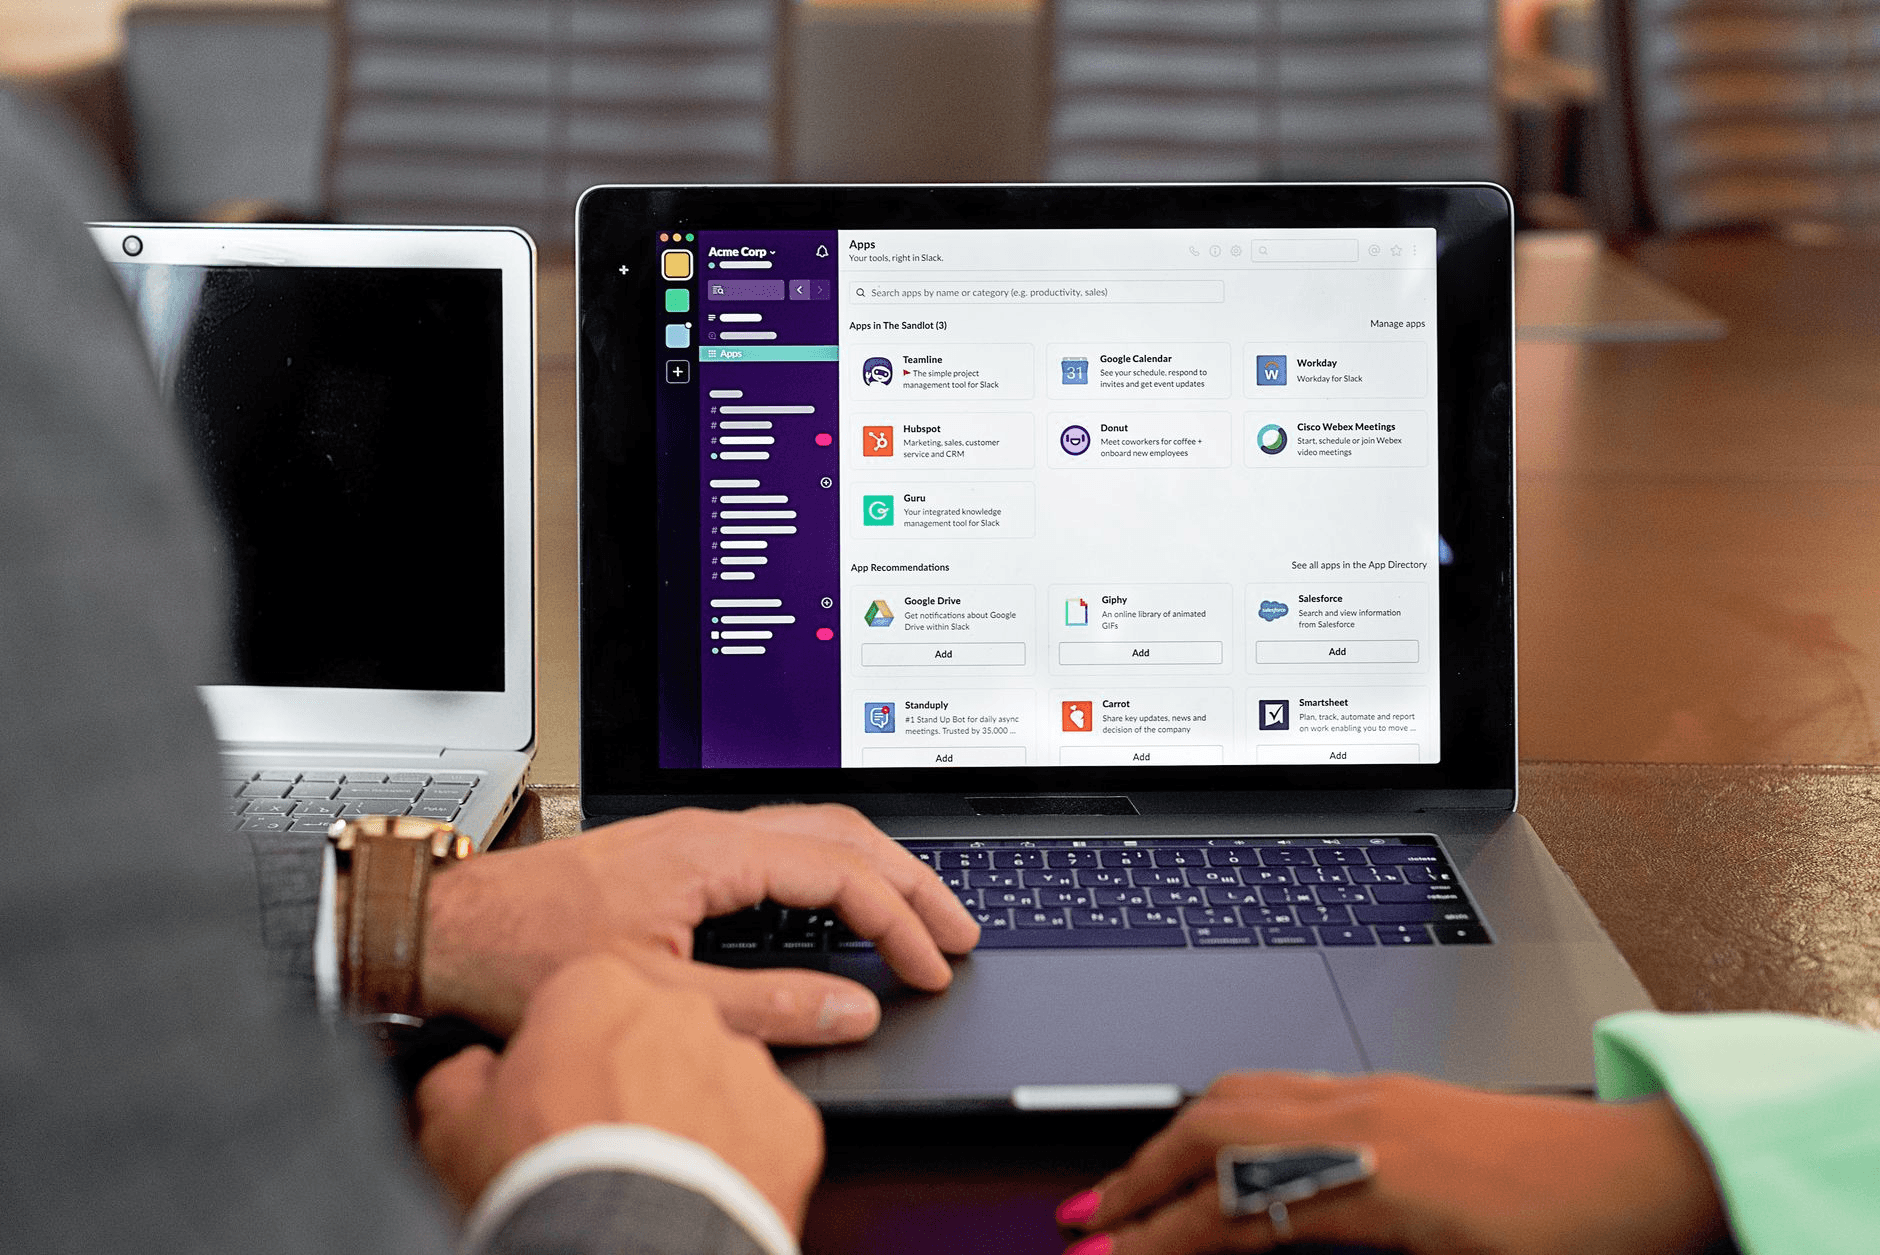
Article
HR Software Development: What It Costs to Build a Workday-Class Platform in 2026
Enterprise companies pay $100-$250 per employee per year for Workday. Custom HR software development for your actual org structure costs $100K-$180K once. Here is what it takes, who should build it, and where these projects break down.
Read more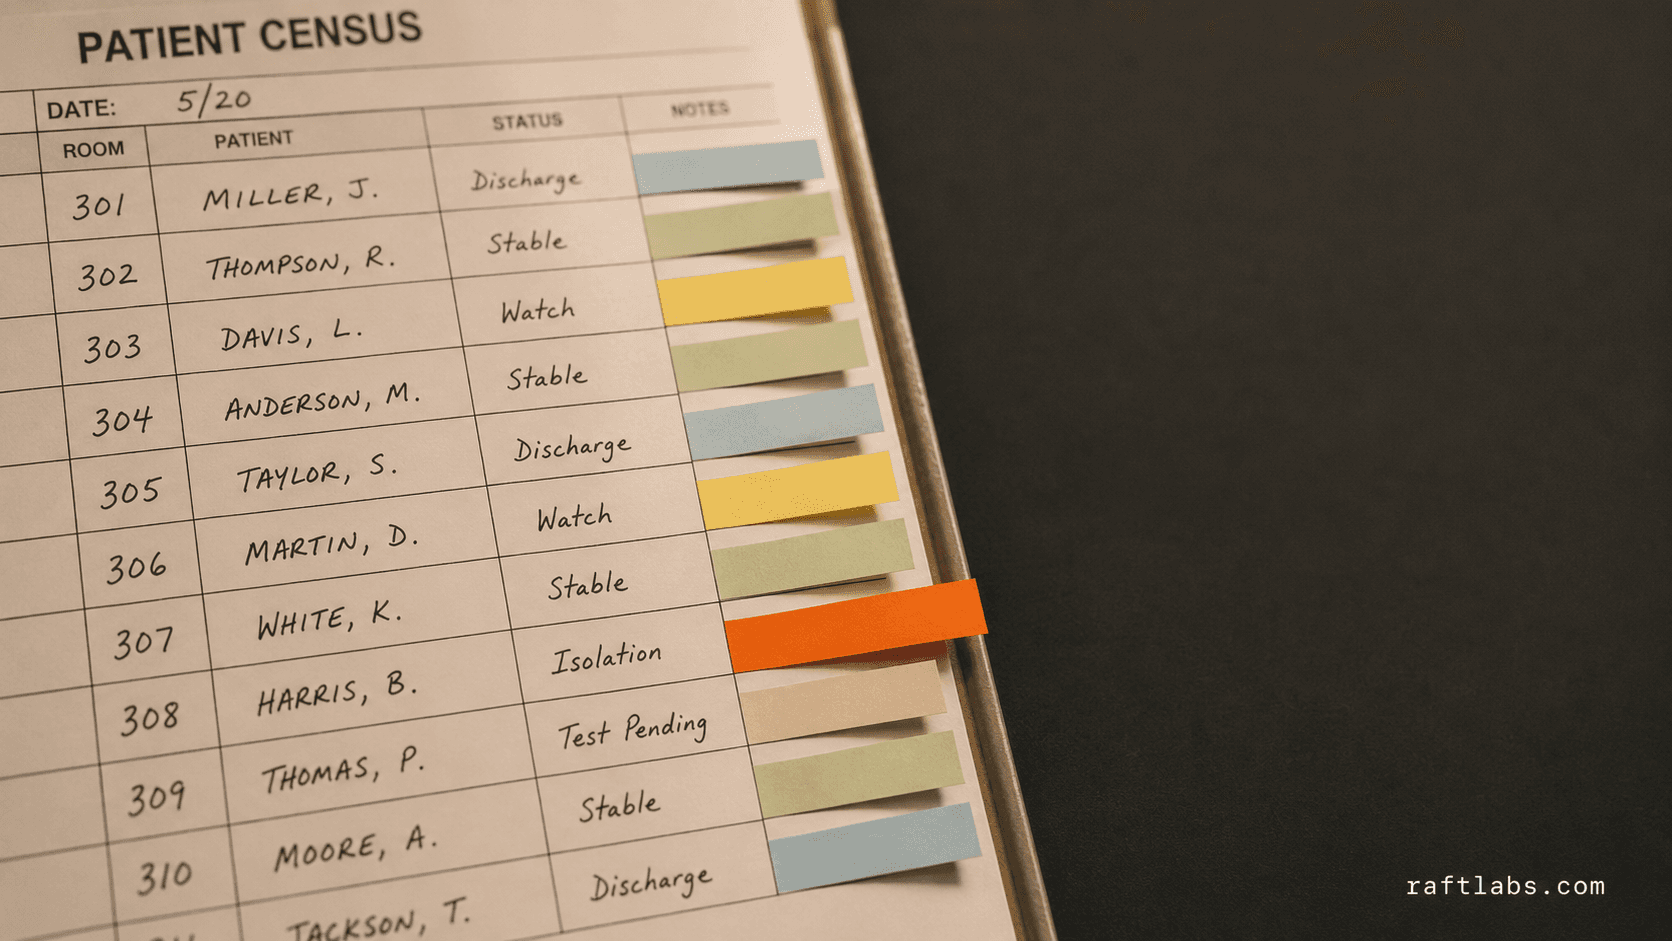
Article
AI for hospital administration: Where the 40% cost problem actually gets solved
Doctors don't want AI making clinical calls. That's fine - the real savings are in admin. Prior auth, billing, scheduling: three workflows where AI cuts costs 30-60% right now.
Read moreWorkflow automation is the use of software to execute a defined sequence of steps automatically, replacing manual coordination, reminder emails, and copy-paste data transfer with reliable, monitored automated processes. A workflow can be as simple as moving a form submission into a CRM and notifying the sales team, or as complex as a multi-stage approval process with conditional routing, SLA monitoring, escalation logic, and integration with six different systems. The common thread is replacing manual coordination with rules-based automation.
Workflow automation operates via APIs, connecting systems programmatically through their official integration interfaces. It is more reliable, faster, and cheaper to maintain than RPA. RPA operates at the UI layer, bots interacting with screens the way humans do. Use workflow automation when systems have accessible APIs and you can connect them programmatically. Use RPA when a system has no API and automation must interact with the UI directly. Most modern systems have APIs. We recommend API-based workflow automation as the default and RPA only when no better option exists.
We build integrations with CRM platforms (Salesforce, HubSpot, Pipedrive), ERP systems (SAP, Oracle, NetSuite, Odoo), communication tools (Slack, Microsoft Teams, email via SendGrid or Postmark), project management tools (Jira, Asana, Linear), payment platforms (Stripe, PayPal), document management systems, custom databases, and any system with a REST API or webhook support. For no-code/low-code platforms, we work with Make (Integromat), n8n, and Zapier for simpler workflows, and build custom for complex orchestration.
No-code tools (Make, Zapier, n8n) work well when the workflow is simple (3-5 steps), the systems you need to connect have pre-built connectors, and you don't need complex conditional logic or exception handling. Custom development fits when the workflow has complex branching logic, exception handling requirements, SLA monitoring, or integration with systems that don't have pre-built connectors. Many businesses start with no-code tools and hit their limits. We build custom workflows when the no-code solution cannot support the business requirements.
Every production workflow needs exception handling: what happens when an API call fails, when required data is missing, or when an approval SLA expires. We design exception paths for every workflow step, retry logic for transient failures, human escalation for exceptions requiring judgment, alerting for failures that require immediate attention, and audit logging for compliance workflows. Workflows without exception handling fail silently and create more manual work than they saved.
A first workflow connecting 2-3 systems with straightforward trigger-action logic starts around $5,000-$15,000. As you add complex conditional logic, approval routing, SLA monitoring, and exception handling, a multi-step platform grows to $20,000-$60,000. Enterprise workflow platforms with a library of automations, monitoring dashboards, and ongoing maintenance run higher. We scope every project against your specific workflow requirements before pricing.
Work with us
We scope Workflow Automation Services in 30 minutes. You walk away with a clear cost, timeline, and approach. No commitment required.