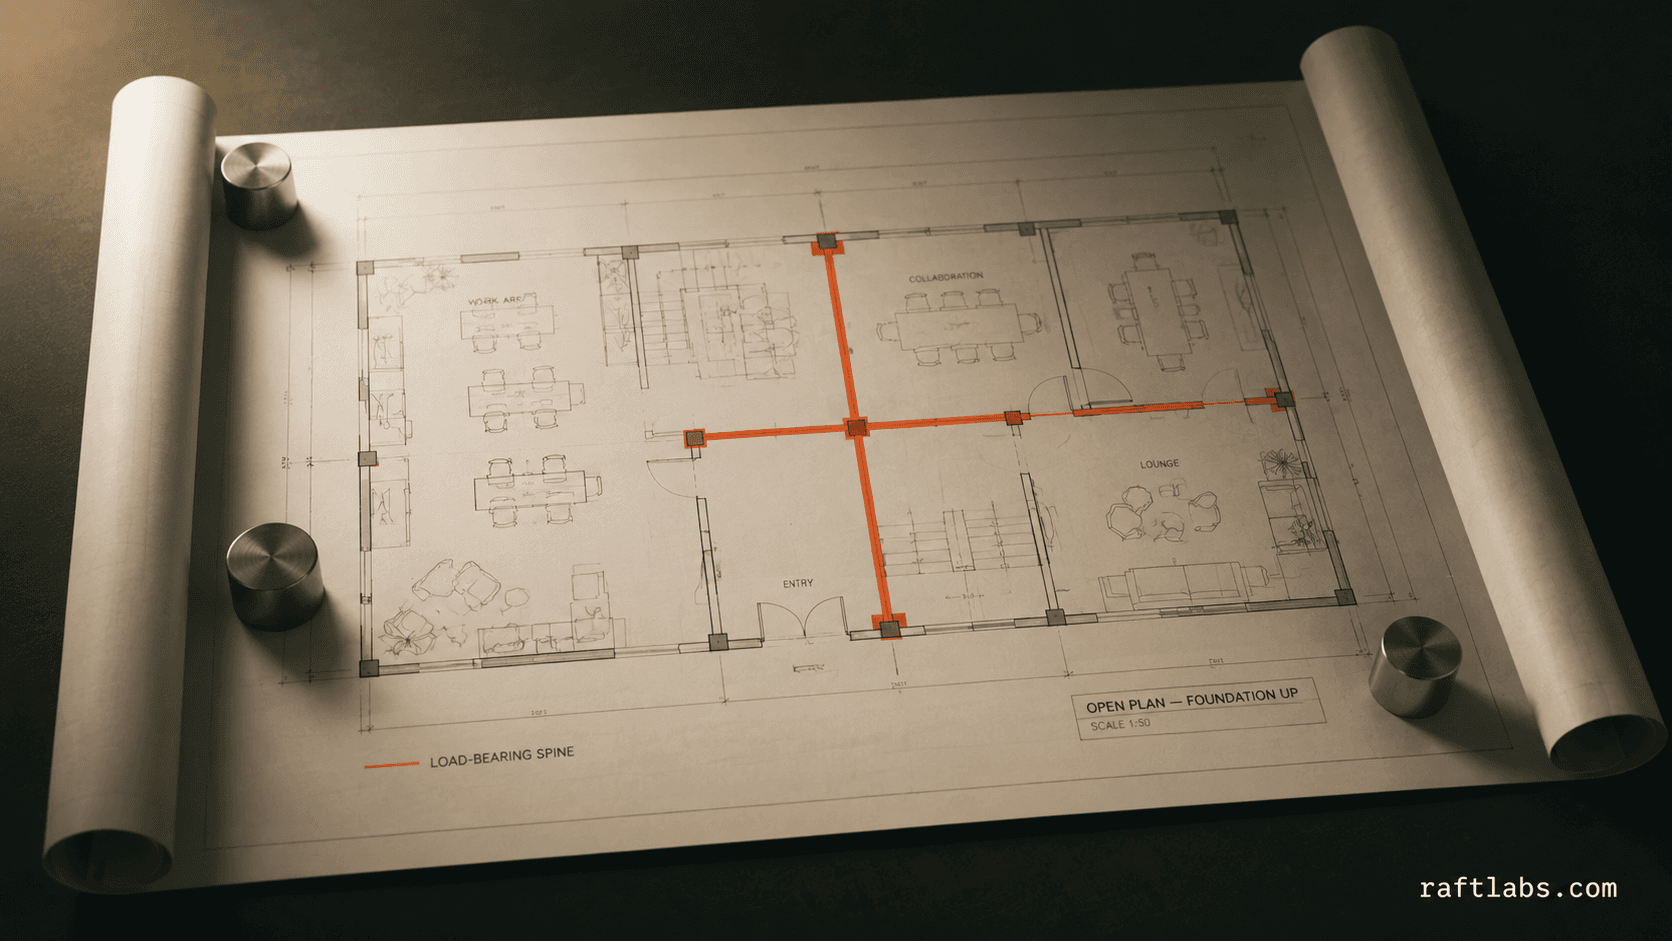
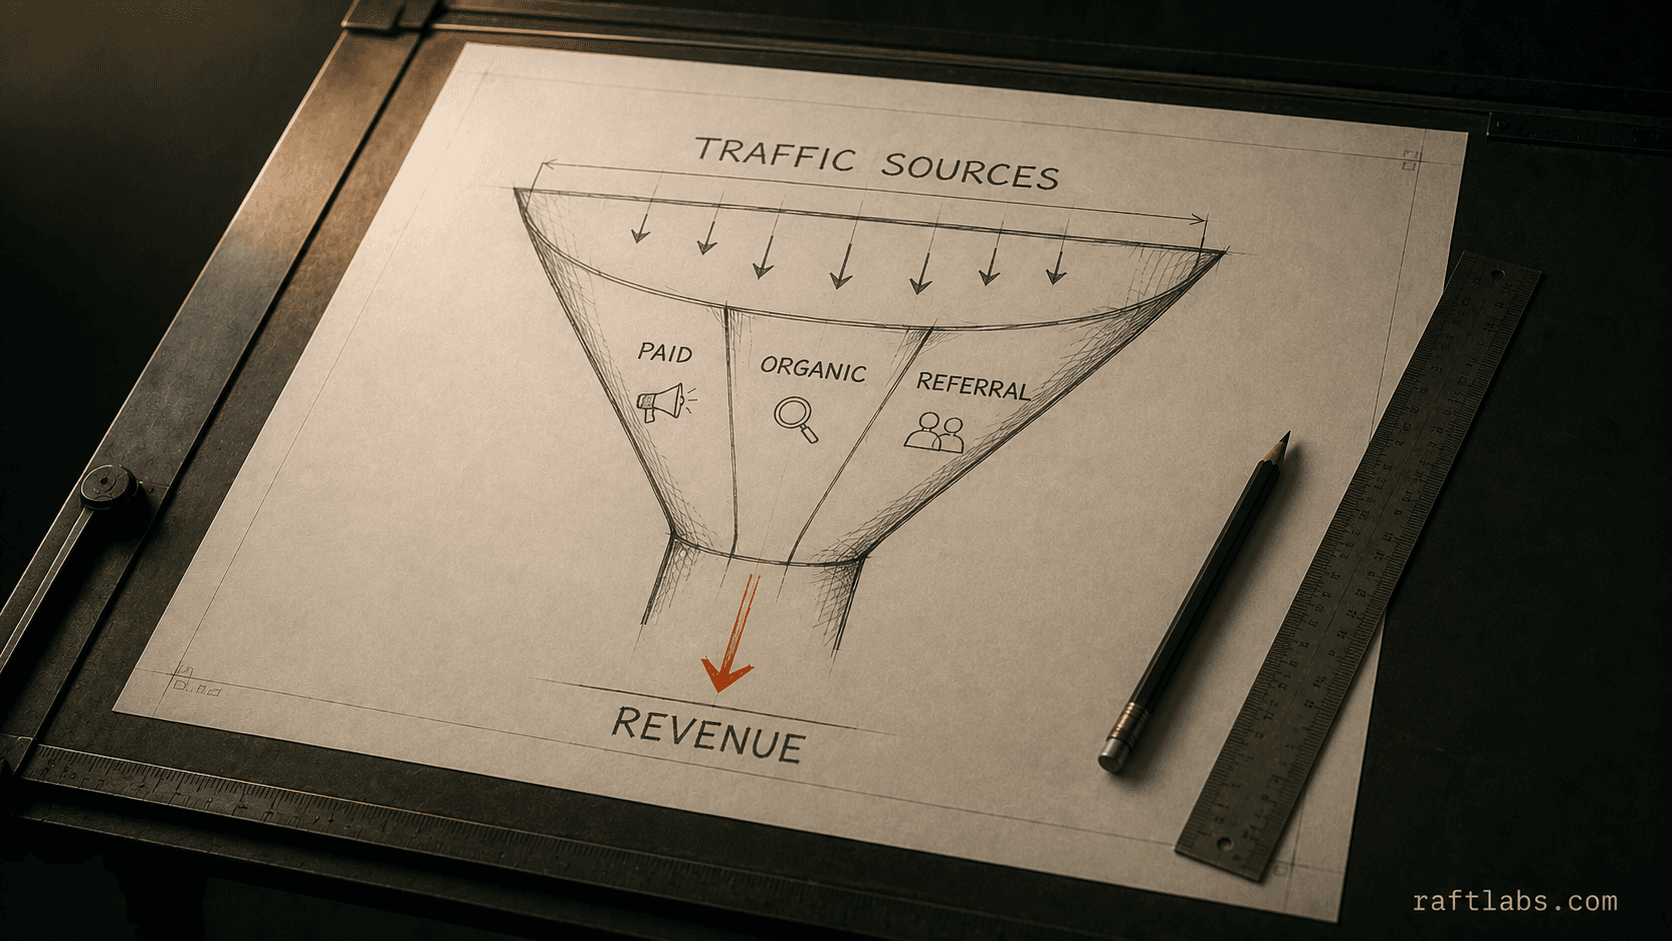



Four people produce four different revenue numbers because four systems each have a partial, inconsistent view of the same data.
A data warehouse is the single agreed source of truth that every report, dashboard, and ML model draws from. It brings together data from ERP, CRM, product databases, and SaaS tools, applies consistent business logic, and makes the combined dataset queryable by analysts and BI tools without touching production systems.
We design and build data warehouses on Snowflake, BigQuery, Redshift, or Databricks. Schema design, data modelling with dbt, pipeline integration, and the semantic layer that makes data accessible to people who are not data engineers. Scoped and priced as one engagement.
Warehouse on Snowflake, BigQuery, or Redshift -- chosen for your workload and cost profile
dbt-based transformation layer with version-controlled, tested SQL models
Semantic layer that defines business metrics consistently across every report
Historical data migration from existing data stores, spreadsheets, and legacy databases
RaftLabs designs and builds data warehouses on Snowflake, BigQuery, Redshift, and Databricks. Schema design, dbt transformation models, semantic layer, and pipeline integration from ERP, CRM, product databases, and SaaS tools. A warehouse covering 3 to 5 source systems with core entity models typically costs $30,000 to $80,000 and delivers in 8 to 12 weeks. A full build with semantic layer, historical migration, and a complete dbt suite runs 12 to 20 weeks.
Trusted by
Every report, dashboard, and business decision eventually depends on a consistent, queryable data layer. Without a warehouse, analysts query production databases directly (risking performance issues and inconsistent results), pull manual exports from each system, or build one-off scripts that become unmaintainable. The result is a different revenue number from every team, a data definition that lives in someone's head rather than the codebase, and reporting that can't scale as the business grows.
A data warehouse solves this by creating a single layer where all source systems land, business logic is applied consistently, and analysts and BI tools can query without understanding the operational structure of each upstream system. Building that layer is a design and engineering project. We handle the architecture decisions, the physical build, the transformation models, and the handoff to the team that maintains it.
Capabilities
What we build
Warehouse platform selection and setup
Platform assessment based on your existing cloud infrastructure, data volume, query patterns, team SQL proficiency, and cost constraints -- with the recommendation documented and justified before procurement decisions are made. Snowflake: separation of storage from compute means query costs scale with usage rather than provisioned capacity; virtual warehouses scale independently per team or workload; Data Sharing enables cross-organisation data collaboration without copying data; ideal for organisations with variable query concurrency or multi-cloud infrastructure. BigQuery: serverless, no cluster management, tightly integrated with Google Cloud services (Vertex AI, Looker, Pub/Sub), pricing at on-demand per-TB or flat-rate slot reservations depending on workload predictability; optimal for GCP-native organisations. Redshift: columnar storage with mature RA3 node type for storage-compute separation, Redshift Spectrum for querying S3 data directly, strong performance for large predictable SQL workloads on AWS. Databricks: Delta Lake format with ACID transactions, Unity Catalog for unified governance across SQL and ML workloads, ideal when data science teams need the same data as analysts. Initial setup: VPC configuration for private connectivity between source systems and warehouse, IAM roles and policies for least-privilege access, resource monitors and cost alerts to prevent runaway query costs, and environment separation (dev/staging/production schemas or databases).
Data modelling and schema design
Dimensional data modelling using star schema patterns for BI-optimised query performance: fact tables (orders, sessions, events, transactions) at the grain of the most granular business event, surrounded by dimension tables (customer, product, date, geography, salesperson) that enable any combination of grouping and filtering without schema changes. Snowflake schema used where dimension tables have significant sub-dimensions that would create excessive column count in a star schema. The data model is designed around your actual business questions -- "revenue by product line by region by month" defines the dimensions needed, not the other way around. Naming conventions and grain documentation for every fact table: the grain (one row = one order line item, not one row = one order) documented explicitly so downstream analysts know what a COUNT(*) means. Three-layer architecture: raw_ staging tables preserving source data exactly as received (audit trail, re-processing capability), stg_ staging models applying cleaning and standardisation (type casting, null handling, deduplication), and mart_ business entities applying the business logic that definitions dictate (a mart_orders model applies the agreed revenue recognition rule, not each analyst's interpretation). Schema documentation generated from dbt model descriptions and column-level descriptions -- a browsable data dictionary that analysts reference before writing a query, reducing the "what does this field mean" questions to data engineering.
dbt transformation layer
dbt (data build tool) transformation layer with every business-defined transformation written as a modular SQL SELECT statement committed to a git repository -- version-controlled, code-reviewed, and deployable via CI/CD pipeline rather than applied manually in a warehouse console. Materialisation strategies selected per model based on data volume and refresh frequency: table for small lookup dimensions refreshed fully each run, incremental for large fact tables where only new or changed records are processed (using updated_at watermarks or stream CDC change detection), and view for lightweight transformations where compute cost at query time is acceptable. dbt tests configured at the model level: not_null and unique tests on primary keys catch upstream data quality issues before they corrupt downstream reports; relationships tests verify foreign key integrity between fact and dimension tables; accepted_values tests validate categorical fields against the agreed value set. Custom schema tests for business logic assertions: total revenue per order must equal the sum of line item revenues; customer counts must be non-decreasing; order status must follow a valid state transition sequence. dbt CI integration: the test suite runs automatically on every pull request against a development schema before merging, catching model errors without deploying to production. Generated dbt documentation published as a browsable web UI showing the DAG of model dependencies, test results, and column descriptions -- the living documentation that stays accurate because it generates from the code rather than being maintained separately.
Semantic layer and metric definitions
Centralised metric definitions implemented in a semantic layer so every business metric has one definition, one calculation, and one number -- regardless of which BI tool, analyst, or dashboard is asking the question. Options based on your BI tooling: dbt Metrics (dbt's native semantic layer, now dbt Semantic Layer with MetricFlow), Looker LookML (semantic definitions in Looker that generate SQL dynamically), Cube.js (headless semantic layer serving metrics to any BI tool or API), or Power BI semantic model (DAX measures centralised in a shared dataset). Metric definitions cover the business concepts that produce disagreements: revenue (invoiced vs cash vs recognised, including returns and refunds), churn rate (the definition of an active customer, the numerator, the denominator, the period boundary rules), customer acquisition cost (which costs are included, over what period, for which customer segments), lifetime value (prediction horizon, discount rate if NPV-based, segment breakdowns). Each metric definition documented with the business name, the calculation in plain language, the SQL formula, the edge cases explicitly excluded, and the data steward responsible for changes. The process for changing a metric definition: the change is proposed, reviewed with the business stakeholders affected, merged into the semantic layer via a pull request with a dbt or LookML diff showing the downstream impact, and communicated to report owners before deployment -- so metric changes are deliberate and traceable, not discovered when a dashboard number changes unexpectedly.
Historical data migration
Migration of historical records from legacy databases, spreadsheets, CSV archives, and deprecated data stores into the new warehouse. Data cleaning and standardisation applied during migration so historical records conform to the same schema and business logic as current records. Reconciliation reports confirming that migrated totals -- revenue, order counts, customer counts -- match the source systems within an agreed tolerance. Historical data is a business asset; migration preserves it in a queryable form rather than archiving it somewhere inaccessible.
BI tool integration and handoff
Connection setup for Looker, Tableau, Metabase, Power BI, or the BI tool your team already uses. Semantic layer exposure to the BI tool so analysts build dashboards from business-defined metrics rather than raw warehouse tables. Query pattern guidance for analysts so reports run efficiently at warehouse scale without triggering expensive full-table scans. Documentation of the data model, mart layer, and metric definitions delivered to the team that maintains the warehouse after the engagement ends.
Have a data warehouse project?
Tell us your source systems, reporting use cases, and where analysts waste time today because data isn't consistent. We'll scope the warehouse and give you a fixed cost.
Cloud Migration -- move existing databases and infrastructure to cloud
Frequently asked questions
Snowflake is the most flexible choice -- it separates storage from compute, scales independently, and works well across cloud providers. BigQuery is the right choice if your organisation is already in Google Cloud and you want to avoid data movement costs. Redshift performs well for large-volume SQL workloads if you're already on AWS and your access patterns are predictable. Databricks makes sense when your warehouse workloads and ML workloads share the same infrastructure. We assess your existing cloud infrastructure, data volume, team SQL proficiency, and cost constraints before recommending a platform.
dbt (data build tool) is a transformation framework that lets you write data transformations as SQL SELECT statements, version-control them in git, test them automatically, and generate documentation from the model definitions. For most data warehouse projects it is the right tool for the transformation layer because it makes transformations reproducible, testable, and auditable. The alternative -- ad-hoc transformation scripts or stored procedures -- creates a transformation layer that is hard to test, hard to change, and impossible to document systematically. We use dbt as the default transformation tool and will tell you if your project is simple enough not to need it.
A warehouse covering 3 to 5 source systems with core entity models and BI tool integration typically takes 8 to 12 weeks. A more complete build with semantic layer, historical data migration, and a full dbt transformation suite typically takes 12 to 20 weeks. The variables are source system count and complexity, data quality issues in those systems, number of business entities to model, and whether historical migration is in scope.
A warehouse designed for change uses version-controlled dbt models as the transformation layer. When a business definition changes -- for example, how 'active customer' is defined -- you update one model, run the tests, and the change propagates consistently to every downstream report. The semantic layer ensures that metric changes are applied once rather than across every dashboard. We build warehouses with a clear separation between raw data, cleaned staging models, and business-logic marts so that changes in one layer don't cascade unpredictably into others.
Work with us
Tell us what you need. We'll tell you what it would take.
We scope Data Warehouse Development in 30 minutes. You walk away with a clear cost, timeline, and approach. No commitment required.
Scope and cost agreed before work starts. No surprises. No obligation.
Working prototype within 3 weeks of kickoff.
Pay by milestone. You see progress before each invoice.
60-day post-launch warranty. Bug fixes, UI tweaks, and deployment support. No retainer.