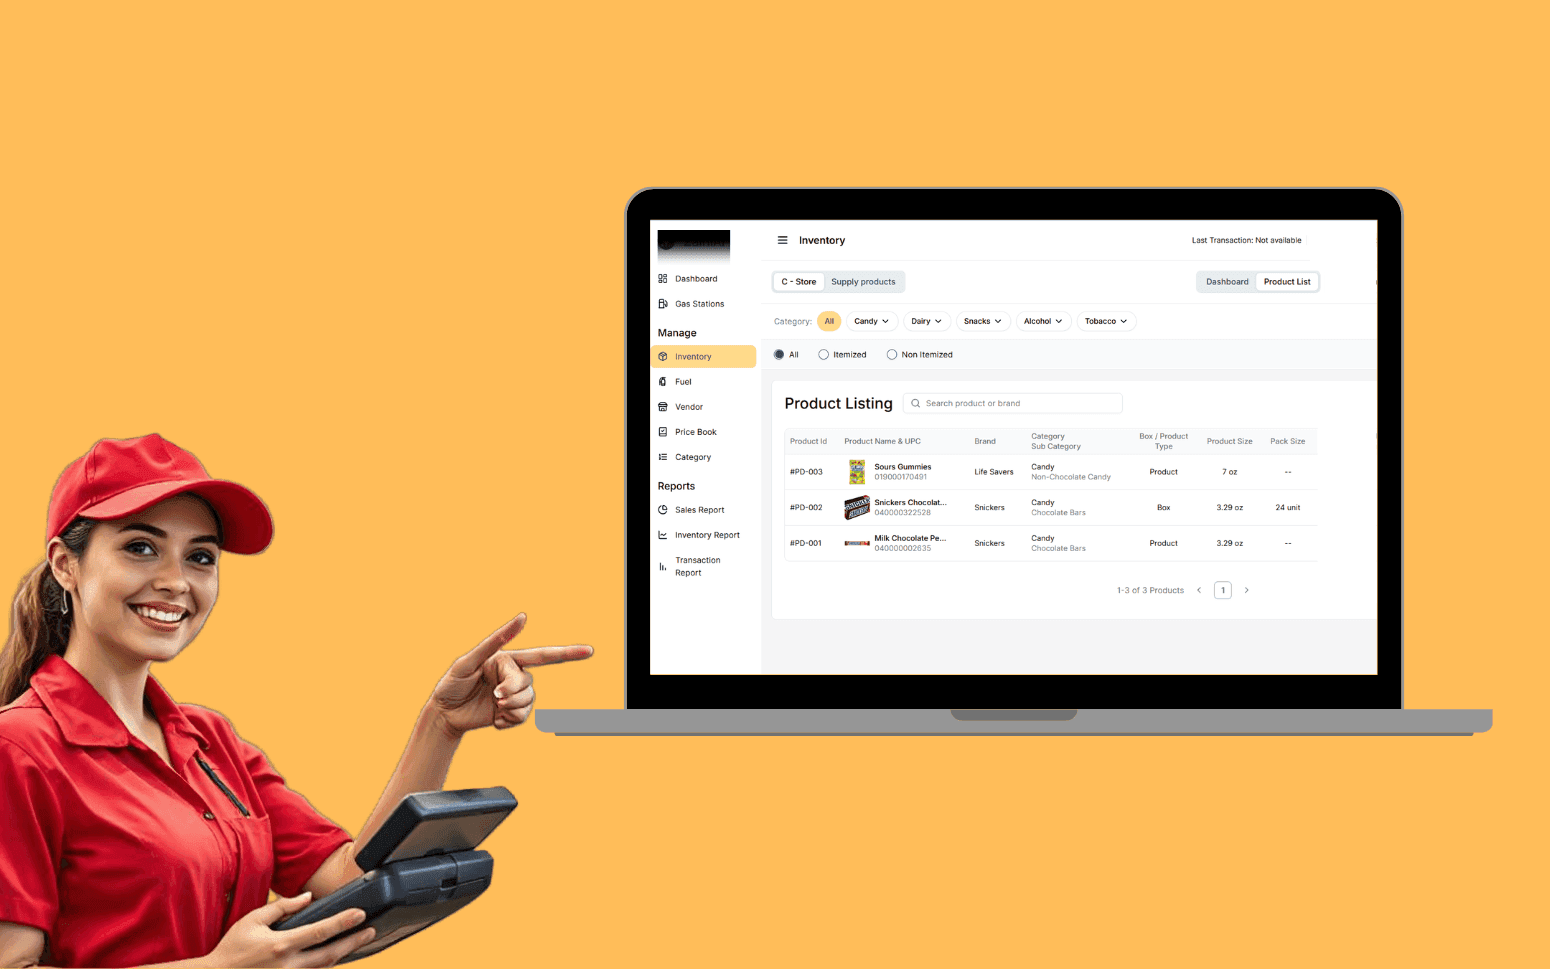
AI OCR Software Scales Gas Station Operations With 20K+ Transactions
- 20K+
- 40+
- 70%
Custom carbon accounting platforms tracking Scope 1 direct emissions, Scope 2 purchased energy emissions, and Scope 3 value chain emissions. Data pipelines from energy meters, fuel logs, fleet telemetry, and supplier assessments. GHG Protocol-compliant calculations with the audit trail regulators require.
Most organisations undercount their emissions because they lack the data pipelines to collect activity data at the granularity carbon accounting requires. We build the collection and calculation infrastructure that makes your carbon figures defensible.
Scope 1 and 2 emissions tracking from energy meters, fuel logs, and utility data
Scope 3 value chain emissions with supplier data collection and spend-based estimation
GHG Protocol-compliant calculations using IPCC, EPA, DEFRA, and IEA emission factor databases
Carbon reduction target tracking with trend analysis and pathway modelling
Recognition
Carbon footprint calculated once a year from energy bills and a spend-based estimate, producing figures that don't survive a detailed regulatory or investor data quality review?
Scope 3 emissions left out of your carbon disclosure entirely because collecting supplier and value chain data manually is not operationally feasible?
In short
RaftLabs builds custom carbon tracking software for organisations measuring and reporting greenhouse gas emissions across Scope 1, 2, and 3. We build data pipelines from energy meters, fuel logs, fleet telematics, and supplier assessments, apply GHG Protocol-compliant emission factor calculations, and produce the carbon accounting records that regulators and external assurance providers require. Most carbon tracking software projects deliver in 10 to 14 weeks at a fixed cost.
Companies we've built for








Organisations that struggle to report their carbon emissions accurately almost always have the same underlying issue: activity data isn't collected at the granularity carbon accounting requires. Energy consumption is available at a building level but not by floor or by process. Fleet fuel data is in a spreadsheet maintained by one person. Scope 3 data from suppliers doesn't exist in any structured form. The carbon figure published in the sustainability report is an estimate built on other estimates.
Custom carbon tracking software solves this at the data collection layer. Energy meters feed consumption data automatically. Fleet telematics provide fuel and distance data without manual extraction. Supplier portals collect primary emissions data for the most significant supply chain relationships. Emission factors from authoritative databases are applied to activity data rather than to spend estimates wherever primary data is available. The result is a carbon figure that can be traced back to its source data and calculation methodology.
Direct emissions tracking for combustion sources, natural gas, fuel oil, diesel generators, and process gases, from meter data and fuel purchase records. Fugitive emissions from refrigerants tracked against charge and recovery records. Scope 2 purchased electricity emissions calculated using both location-based and market-based methods as GHG Protocol requires. Renewable energy certificate (REC and REGO) management so market-based Scope 2 reflects your actual electricity procurement. Monthly and annual emissions summaries by facility, by energy source, and by business unit for internal management and external disclosure.
Scope 3 emissions across the GHG Protocol categories relevant to your business: purchased goods and services (categories 1 and 2), business travel (category 6), employee commuting (category 7), upstream transportation (category 4), downstream transportation (category 9), use of sold products (category 11), and end-of-life treatment (category 12). Primary data collection from suppliers and logistics providers for the most significant categories. Spend-based and activity-based estimation for categories where primary data is unavailable, with transparent documentation of the methodology and emission factors applied.
Automated data pipelines from energy management systems, smart meters, and utility provider APIs. IoT sub-meter data ingestion via Modbus TCP and BACnet protocols connects building-level meters and process equipment directly to the carbon account without manual data export. Integration with Schneider Electric EcoStruxure, Siemens Desigo, and building automation systems. Utility bill OCR using AWS Textract processes PDF invoices from electricity, gas, and water suppliers, extracting consumption quantities and tariff details automatically where API access to the utility is unavailable. Utility provider API connections for electricity, natural gas, water, and district heat. Interval data processing for high-frequency meter reads where hourly or 15-minute data is available. For Scope 2, emission factors are drawn from the EPA eGRID database for US grid regions, DEFRA conversion factors for UK operations, and the ECOINVENT database for process lifecycle data, applied using both location-based and market-based methods as GHG Protocol Scope 2 guidance requires. Data quality monitoring flags gaps, anomalies, and meter failures before they create holes in the carbon account.
Fleet emissions tracking from telematics systems, fuel consumption and distance by vehicle, by driver, and by journey type. Integration with fleet management platforms (Samsara, Verizon Connect, Geotab) and fuel card providers. Business travel emissions from corporate booking tools and expense systems, air miles converted to emissions using DEFRA or ICAO methodology, hotel nights, and ground transport. Employee commuting surveys and home-working carbon calculations for remote workforce. The travel and transport emissions categories that are often significant but rarely tracked systematically.
Science-Based Targets initiative (SBTi) aligned carbon reduction pathways with annual milestones tracked against actual emissions performance. The platform models both 1.5-degree and well-below-2-degree Net Zero pathways so you can see how your current trajectory compares against the standard your investors or customers may require. Absolute reduction targets and intensity targets (emissions per unit of revenue or production) tracked in parallel. Variance analysis when emissions performance diverges from the target pathway, identifying which facilities, business units, or emission categories are driving the variance. CDP climate questionnaire response automation pulls emissions data and reduction target progress directly from the platform into the standard CDP response format, reducing the manual effort of completing the annual disclosure. EU Taxonomy activity alignment tagging links emission reduction initiatives to the relevant environmental objectives so sustainability reports can demonstrate taxonomy alignment. Reduction initiative tracking links specific decarbonisation projects to their expected and actual emissions impact. The management view that makes carbon targets operational rather than aspirational.
A complete audit trail for every emissions figure: source data record, emission factor applied, calculation methodology, and the person who approved the figure for reporting. Evidence file management linking supporting documentation, energy invoices, fuel receipts, and supplier emissions certificates, to the emissions records they support. Third-party verifier access with read-only views of the audit trail and supporting evidence. For organisations required to report under CSRD, the platform produces ESRS E1 climate change disclosures structured to meet the European Sustainability Reporting Standards, including gross Scope 1, 2, and 3 breakdowns. XBRL and iXBRL tagging prepares emissions disclosures in machine-readable format for SEC climate disclosure submissions where required. Carbon offset retirement records are tracked through registry integration. Gold Standard and VERRA VCS registry APIs confirm retirement status and credit vintage so offset claims in the carbon account are verifiable. Version control for emission factor updates and methodology changes allows prior-period restatements to be calculated and documented when factors change. The verification infrastructure meets GHG Programme requirements for third-party assurance at reasonable assurance or limited assurance level.
The GHG Protocol defines three emission scopes. Scope 1 covers direct emissions from sources owned or controlled by your organisation: combustion of natural gas and fuel oil in your buildings, diesel in your vehicles, and process emissions from your industrial operations. Scope 2 covers indirect emissions from purchased electricity, heat, steam, or cooling. The emissions occur at the power station, not at your facility, but your consumption drives them. Scope 3 covers all other indirect emissions in your value chain: the emissions from producing the goods you buy, from your suppliers' operations, from your customers using your products, and from business travel. Scope 3 is typically the largest category for most organisations and the hardest to measure accurately.
Scope 3 Scope calculation uses a tiered data quality approach. For your most significant supply chain relationships, we build supplier data collection portals that gather primary emissions data directly. For mid-tier suppliers, we use activity-based estimation with industry-specific emission factors applied to procurement quantities. For the long tail of suppliers where primary or activity data is unavailable, we use spend-based estimation with environmentally extended input-output (EEIO) data. The methodology for each category is documented and disclosed alongside the figures. Data quality scores flag which portions of your Scope 3 inventory are primary data versus estimates so stakeholders understand the confidence level of each category.
We use the authoritative emission factor databases appropriate for each activity type and jurisdiction. UK Defra Conversion Factors for UK operations and international business travel. EPA Emission Factors for the US. IEA Electricity Emission Factors for country-specific grid emissions. IPCC Assessment Report factors for global warming potentials of greenhouse gases other than CO2. AIB European Residual Mixes for market-based Scope 2 in Europe. Ecoinvent for product lifecycle emission factors where EEIO data is used for Scope 3 estimation. Emission factor databases are version-controlled in the system so updates are applied consistently and prior-period calculations can be restated when factors change.
A focused carbon tracking platform covering Scope 1 and 2 emissions with three to five operational data source integrations typically costs $20,000 to $60,000. A full platform extending to Scope 3 with supplier data collection portals, logistics and travel integrations, third-party verifier access, and SBTi target tracking typically costs $60,000 to $150,000. The range depends primarily on the number of data source integrations and whether Scope 3 supplier data collection is included. We scope the project and fix the cost before development starts.
What clients say
Three-year average engagement. Founders and operators describing the work in their own words. No marketing varnish.

 USA
USAAll of the sprints were completed on schedule and on budget. We highly recommend RaftLabs!
01 / 02
Tell us your emission scopes, current data sources, and regulatory reporting obligations. We'll design the carbon accounting system and give you a fixed cost.