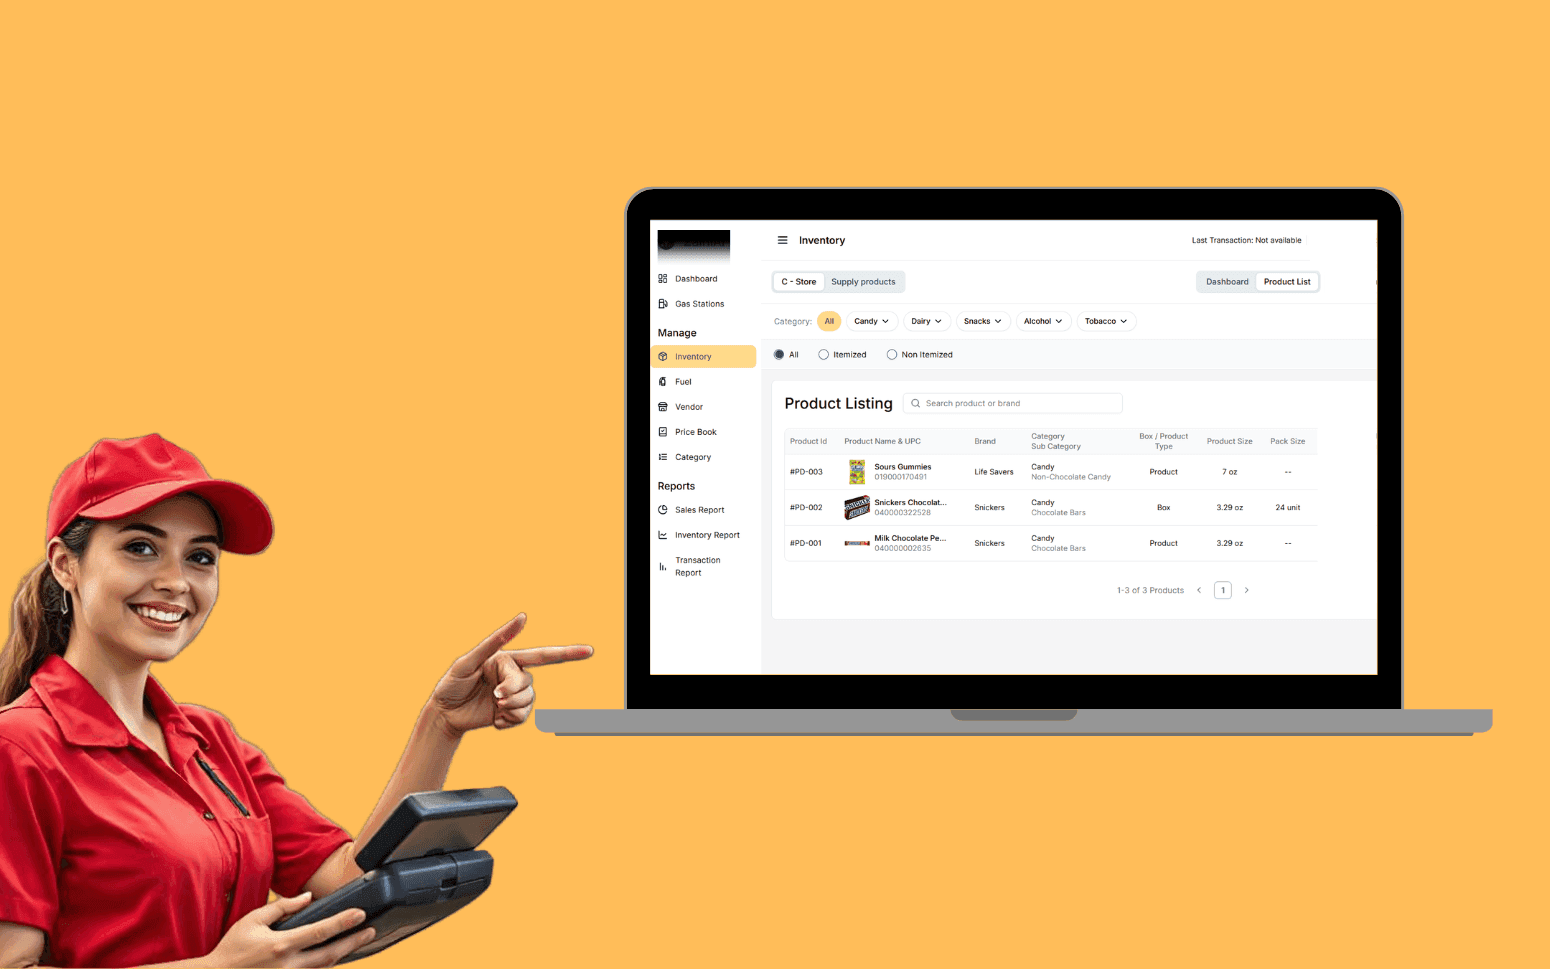
AI OCR Software Scales Gas Station Operations With 20K+ Transactions
- 20K+
- 40+
- 70%
Real-time generation data from inverters, meters, and weather sensors. Fault detection with automated alerting. Customer portals that show output, savings, and system health in plain language. Fleet dashboards for installers managing dozens or hundreds of sites.
We build custom solar monitoring platforms for installers, EPCs, and asset owners. From inverter API integration to portfolio-level performance analytics, we cover the full monitoring stack.
Real-time generation data from inverters, meters, and weather sensors
Fault detection with automated alerting and severity classification
Customer portal with generation, savings, and environmental impact
Fleet-level monitoring for installers managing multiple sites
Recognition
Solar monitoring dashboard polling inverters every 15 minutes and missing fault events until the customer calls to report zero generation?
Customer-facing portal showing raw kWh numbers with no context about expected output, savings to date, or what a fault alert means?
In short
Solar monitoring software connects inverter and meter data to a platform that tracks real-time generation, detects faults before customers call, and gives site owners a clear view of output, savings, and system health. RaftLabs builds custom solar monitoring platforms for installers, EPCs, and asset owners, from single-site customer portals to fleet-level dashboards managing hundreds of systems.
Companies we've built for








A 15-minute polling interval is standard for most inverter APIs. A fault that trips at 9am and stays undetected until the customer calls at 3pm is six hours of lost generation. Multiply that across a fleet of 200 sites and the performance gap adds up fast.
Custom solar monitoring software changes the response model. Real-time event streams from inverter APIs detect faults in minutes, not hours. Automated alerts route to the right technician with fault type, severity, and site detail attached. The customer sees a clear status in their portal before they think to call.
Inverter data ingestion via manufacturer APIs and local Modbus RS-485 or Modbus TCP connections for inverters that expose data over the site network. Communication protocols supported include Modbus RTU over RS-485 for older inverter strings, Modbus TCP for network-connected inverters, DNP3 for utility-scale SCADA integration, and IEC 60870-5-104 for grid-connected systems where the DNO requires a standardised telemetry protocol. Support for SolarEdge via the Monitoring API, Enphase via the Enlighten API, Fronius via the Solar.web API and local Fronius Data Manager, SMA via the Sunny Portal API and local Modbus interface, Huawei via the FusionSolar API, and ABB via FIMER.
Smart meter integration for import, export, and self-consumption tracking supplements inverter generation data with actual grid exchange measurements. Irradiance data is integrated from NREL NSRDB (National Solar Radiation Database) or SolarAnywhere for sites without a local irradiance sensor, enabling performance ratio calculation and weather-normalised yield comparison without requiring hardware at every site. Data normalised to a common schema regardless of inverter brand. Polling intervals are configured per site based on API rate limits and monitoring requirements, using event-driven triggers for fault conditions rather than waiting for the next scheduled poll.
Performance ratio (PR) calculation following the IEC 61724-1 standard for photovoltaic system performance monitoring: actual energy output divided by reference yield (irradiance on the plane of array divided by standard test condition irradiance multiplied by installed kWp). A PR above 0.75 typically indicates a well-functioning system; values below 0.70 warrant investigation. Specific yield (kWh/kWp) is calculated at system, string, and inverter level to identify underperforming components without requiring a technician visit. Capacity factor tracks actual generation against the theoretical maximum generation at rated output for the same period.
Soiling loss estimation compares PR trend over time against a baseline established after the last cleaning event, giving the O&M team a data-driven signal for when cleaning is economically justified. Weather-normalised yield comparison uses irradiance data from NREL NSRDB or SolarAnywhere to compare what a system actually generated against what it should have generated given the actual weather, removing irradiance variability from performance comparisons between sites or time periods. Clipping detection identifies systems where inverter capacity is undersized relative to array output, a common issue in commercial retrofits where the inverter has not been resized to match the expanded array. Daily, monthly, and annual generation summaries with trend views complete the analysis layer.
Fault event processing from inverter alarm registers with classification by fault type and severity. Ground fault, arc fault, over-temperature, communication loss, and grid disconnect are handled as distinct event types with different severity levels and response protocols. String-level fault detection identifies underperforming strings that do not trigger an inverter-level alarm: a string producing 15% less than its expected current given the measured irradiance is a fault even if the inverter continues to operate and report no errors. This is where a significant share of undetected degradation occurs.
Rule-based and anomaly detection covers fault conditions the alarm registers do not surface: string-level underperformance against irradiance-adjusted expected output, intermittent communication loss patterns that indicate a failing communications device, and production shortfall relative to irradiance that persists across multiple polling intervals. Alert routing by severity sends critical faults, full system offline, ground fault, arc fault, to the on-call technician by SMS within minutes of the event. Degradation alerts route to the service queue by email for review during the next scheduled maintenance window. O&M work orders are generated automatically for underperforming strings that cross a configurable threshold, with site details, fault classification, and historical performance data attached. CMMS integration with IBM Maximo Application Suite routes work orders to your existing maintenance management workflow. Alert suppression rules prevent false positives during grid curtailment, low-irradiance mornings, and scheduled maintenance windows.
Customer portal showing daily, monthly, and lifetime generation in plain language: kilowatt-hours produced, estimated bill savings in dollars or pounds based on the customer's tariff rate, and equivalent carbon offset in tonnes or equivalent trees. The savings calculation is updated daily and cumulative from system installation, so the customer can see the return on their investment accumulating over time. Expected output comparison using weather-normalised yield data from NREL NSRDB or SolarAnywhere shows the customer whether the system is performing normally against what would be expected given recent weather. No need to understand performance ratio or specific yield.
Fault status is shown as a clear indicator with plain-language explanations: not a fault code string, but a description of what the alert means and what the next step is, whether the customer should expect a technician contact, whether the issue is being investigated, or whether the system has already been reset. PPA (Power Purchase Agreement) generation reporting is included for customers on PPA billing structures, showing the generation volume that determines their billing amount and the reference data for any billing disputes. Mobile-responsive design that works on the phone the customer will use to check it. Branded to the installer with their logo, colours, and contact details. The customer sees the installer brand, not the monitoring platform vendor.
Fleet dashboard for installers and asset managers showing all sites in a single view with real-time status indicators: generating normally, degraded performance (PR below configurable threshold), faulted, or offline. Portfolio-level generation summary shows total kWh produced today, this month, and this year across all sites in the fleet, alongside the portfolio-level performance ratio and specific yield for the current period. These are the numbers an asset manager needs for investor reporting and PPA performance verification.
Filter and sort by status, system size, inverter brand, installer, geographic region, or custom tag. Bulk alert review lets a technician triage the full site list sorted by fault severity, with the most urgent sites at the top, without opening each system individually. Clicking through from the fleet view to a site shows the full site detail: string-level performance, fault history, weather-normalised yield trend, and open work orders. SCADA integration via DNP3 or IEC 60870-5-104 connects utility-scale assets into the same fleet view as smaller commercial sites, giving the asset manager a single dashboard regardless of asset type. The operational view that makes managing 50 or 500 sites as manageable as managing five. The interface scales to the fleet size without becoming slower or harder to navigate.
Long-term data retention with efficient time-series storage. 5-minute interval data is retained for the full system lifetime, downsampled to hourly and daily aggregates for long-term trend views without losing granularity for fault investigation. Automated monthly performance reports delivered to customers by email include generation summary, weather-normalised performance ratio, estimated savings, and year-to-date cumulative figures. These are designed to be readable by a non-technical customer who glances at the report once a month, not an operations analyst.
Annual generation summaries for feed-in tariff (FiT) reconciliation and warranty documentation provide the data in the format most DNOs and warranty providers require. PPA generation reporting produces the monthly kWh totals and supporting data trail for billing under Power Purchase Agreement structures. The data is the billing record, and the report needs to be audit-ready. Custom report builder for asset owners who need generation data in specific formats for investors or offtake counterparties: select date range, site or portfolio, and output format. CMMS integration with IBM Maximo Application Suite or similar platforms exports maintenance event history alongside generation data for O&M reporting. Data export in CSV and JSON for integration with asset management or accounting systems. The records layer that makes generation history useful beyond the monitoring dashboard for the full asset lifecycle.
We integrate with the major residential and commercial inverter platforms: SolarEdge via the Monitoring API, Enphase via the Enlighten API, Fronius via the Solar.web API and local Fronius Data Manager, SMA via the Sunny Portal API and local Modbus interface, Huawei via the FusionSolar API, and ABB via FIMER. For inverters without a published cloud API, we use local Modbus RS-485 or Modbus TCP directly over the site network. Most inverters manufactured in the past decade expose a Modbus register map that gives access to generation, string current, and fault status data. The SunSpec Alliance's standardised Modbus register map covers a wide range of inverter brands through a single integration if your inverter supports the SunSpec profile.
For utility-scale assets that connect to SCADA systems, we support DNP3 and IEC 60870-5-104 protocol integration. Where a site has mixed inverter brands, common in commercial retrofits and aggregated portfolios, we normalise data from each brand to a single schema so fleet reporting is consistent across inverter types. Irradiance data from site pyranometers, where available, is ingested alongside inverter data. Where no site sensor exists, we source irradiance from NREL NSRDB or SolarAnywhere for weather-normalised performance analysis. We review your inverter mix during scoping and confirm integration feasibility before development starts.
Threshold alerting fires when a value crosses a fixed line: generation below zero, inverter offline, communication lost. It catches hard failures but misses the degradation that costs money before it becomes a hard failure. A string producing 20% less than expected current given the measured irradiance is losing money every hour the sun shines, but it won't trigger a threshold alert because generation isn't zero and the inverter reports no fault. This gap is where most undetected performance loss occurs.
Fault detection goes further. It compares actual output against expected output calculated from current irradiance (from NREL NSRDB, SolarAnywhere, or a site sensor) and the IEC 61724-1 performance ratio model. String-level underperformance that does not trigger an inverter alarm is flagged based on the current differential between strings on the same inverter. Intermittent failures that clear before the next poll are detected through pattern recognition. A string that drops and recovers every 90 minutes is a failing connection, not normal variability. Soiling loss is estimated from PR degradation trend over time and compared against a post-cleaning baseline. The system also suppresses false alerts during grid curtailment events, low-irradiance conditions below a configurable threshold, and scheduled maintenance windows, so technicians spend time on real faults, not investigating alerts that resolve themselves.
Most solar customers don't know what a performance ratio is, and they shouldn't need to. They want to know three things: is my system working, how much did it save me this month, and what do I do if something is wrong. We design the customer portal around those questions. Generation is shown in dollars or pounds saved, calculated from the actual kWh generated and the customer's grid tariff rate, alongside the kilowatt-hour figure and equivalent carbon offset. The savings figure is the number that motivated the customer to buy solar. It should be the number they see first.
System status is shown as a clear indicator, a green check, an amber warning, or a red alert, with a plain-language explanation of what it means. Not an inverter fault code or a Modbus register value, but a description a customer can act on: "Your system is operating normally and generated more than expected this week given the overcast weather" or "One section of your system is producing less than expected. Your installer has been notified and will be in touch." Alerts include the next step so the customer knows whether to wait, call the installer, or take any action. For PPA customers, the portal shows generation volume and the calculation behind their monthly bill, making the billing transparent and reducing disputes. We test the portal design with real users, people who installed solar two years ago and haven't thought about it since, to confirm the information lands clearly before development concludes.
A customer-facing monitoring portal for a residential or small commercial installer, covering inverter API integration for one or two brands, generation and savings dashboard, fault alerting, and customer portal, typically costs $30,000 to $80,000 depending on the number of inverter integrations and the complexity of the customer portal. A full fleet monitoring system for an EPC or asset manager, covering multi-brand inverter integration, performance analytics, fleet dashboard, automated reporting, and historical data storage for a large portfolio, runs $60,000 to $150,000. We scope the project before pricing it so you know the cost and delivery timeline before development starts.
What clients say
Three-year average engagement. Founders and operators describing the work in their own words. No marketing varnish.

 USA
USAAll of the sprints were completed on schedule and on budget. We highly recommend RaftLabs!
01 / 02
Tell us your inverter brands, fleet size, and what your current monitoring is missing. We'll design the platform and give you a fixed cost.