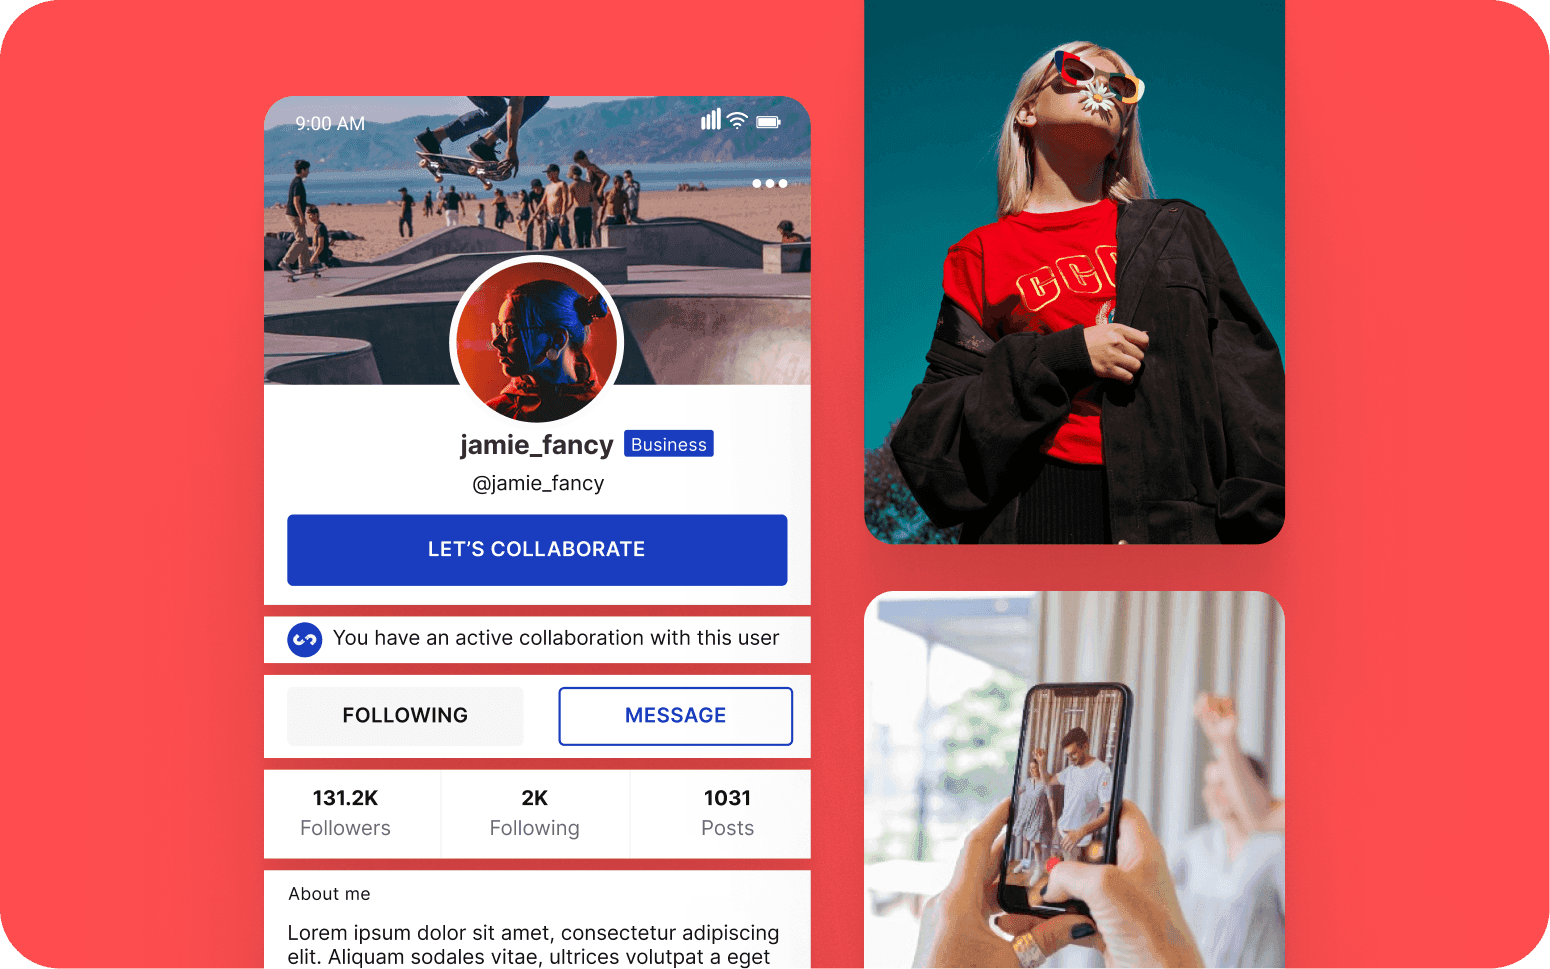
Sponzee Connects Brands and Creators in a Social Commerce Revolution
- 25%
- 2x
- 16 weeks
Custom analytics infrastructure for game studios who need player behaviour data at the depth your game requires: event schemas designed for your game's specific actions, retention analysis by the segments that matter, and economy monitoring that catches inflation before it damages retention.
Generic analytics platforms track what they track. A custom analytics platform tracks what your game team needs to make decisions: the specific progression steps, the economy events, the social interactions, and the live service metrics that determine whether a design change is working.
Game event tracking with schemas designed for your game's specific player actions
Retention cohort analysis by acquisition channel, player segment, and game version
Funnel analysis showing drop-off at each progression step
Economy health monitoring covering currency sources, sinks, and conversion metrics
Recognition
Retention data available but not segmented by acquisition channel, game version, or first session experience, so you know players are churning but not which players or why?
Economy health visible only in revenue numbers, with no view into the currency source/sink balance that shows whether inflation is developing before it becomes a player complaint?
In short
RaftLabs builds custom game analytics platforms for game studios with player event tracking using custom schemas, retention cohort analysis, funnel reporting, economy health monitoring, matchmaking quality metrics, and live service dashboards. Most game analytics projects deliver in 8 to 14 weeks at a fixed cost.
Companies we've built for








The metrics that matter for a game are different from those that matter for a web product. Session length, return visit rate, and page views are web metrics. D1/D7/D30 retention by cohort, match completion rate by skill bracket, progression funnel drop-off by level, and currency source/sink balance are game metrics. They require an analytics platform designed around game data structures, not adapted from a web analytics tool.
A custom game analytics platform is built around your game's event schema: the specific actions players take, the specific progression steps they pass or fail, and the specific economy events that determine whether the live service is healthy. The result is a platform that answers the questions your game team actually asks rather than the generic questions a commercial dashboard makes easy to ask.
Event schema design for your game's specific player actions: session start and end, level attempt and completion, match result, item purchase, social interaction, and any other events your game team needs to analyse. Every event record carries a common envelope: player_id, session_id, event_name, a properties object for event-specific attributes, and a timestamp with millisecond precision. Millisecond timestamps matter for reconstructing session sequences and correlating events that fire within the same frame.
Client SDK for your game engine handles event batching (collecting events locally and sending in groups rather than one HTTP call per event), local queuing for offline play, and transmission when connectivity is available. Server-side event validation confirms that client-reported events carry the required fields and plausible values before ingestion, rejecting negative currency amounts, impossible level numbers, or missing session IDs before they enter the data warehouse. The high-throughput ingestion pipeline uses Apache Kafka or AWS Kinesis Data Streams to handle millions of events per second at peak concurrent player load without backpressure reaching the game API. Event storage lands in ClickHouse or BigQuery, columnar stores purpose-built for the aggregation queries that retention and funnel analysis require at scale. The event pipeline that turns player actions into analysable data without the game client team writing data pipeline code.
Retention cohort analysis tracking the percentage of players who return on day 1 (D1), day 7 (D7), and day 30 (D30) after their first session, the standard intervals used by the industry to benchmark early engagement, medium-term habituation, and long-term retention respectively. Cohorts are sliced by acquisition channel, game version at first install, geographic region, device type, and any other dimension your game team uses to segment the player base. A D1 retention difference of 5 percentage points between two acquisition channels often indicates that one source is delivering players who are a poor fit for the game, which is a media spend insight worth more than the analytics platform cost.
Real-time aggregation with Apache Flink or Kafka Streams processes the event stream into retention counters as events arrive, so retention dashboards reflect the current cohort without waiting for an overnight batch job. Rolling retention tracks the return rate over a moving window rather than just fixed-day cohorts. Engagement depth metrics measure session frequency, session length distribution, and the player actions per session that separate engaged play from passive presence. Reactivation analysis shows how many churned players return after absence and what events correlate with their return. Feature engagement tracking shows which features are adopted by which player segments.
Funnel definition for any progression sequence in your game, the tutorial steps, the level sequence, the unlock pathway, or any multi-step flow where understanding drop-off is important for design decisions. Funnel visualisation shows the completion rate at each step and the absolute player count at each stage: how many players started the tutorial, how many completed step one, how many reached step five, and how many finished. The absolute counts at each stage are as important as the percentage drop-off. A 15 percent drop at step three matters differently when the funnel starts with 50,000 players versus 500.
Time-to-complete analysis shows the distribution of time players spend at each funnel step, identifying steps where players stall rather than quit. A stall followed by low return rate identifies a difficulty spike or a confusing UI element more precisely than quit data alone. A/B test funnel comparison uses the Mann-Whitney U test to assess whether the difference in completion rates between test and control groups is statistically significant before shipping a change, avoiding the false conclusions that come from calling a winner too early on small sample sizes. Segmentation overlays show whether drop-off patterns differ by device, acquisition channel, or player segment. The funnel analysis that makes progression design an evidence-based process rather than an intuition-driven one.
Currency source and sink balance tracks the ratio of virtual currency entering the economy (gameplay rewards, purchased currency bundles, daily login bonuses) to currency leaving it (item purchases, crafting costs, battle pass spend) across the player population in real time. Virtual currency inflation develops gradually. The economy looks normal until a critical mass of players has accumulated enough currency that the premium shop loses relevance. The monitoring system detects the early signal: the source/sink ratio drifting above the design parameter for three consecutive days triggers an alert to the economy designer before players notice and start posting on community forums.
Inflation and deflation detection uses configurable threshold bands tied to design targets. Conversion rate tracking follows the pipeline from active player to first purchaser (day-7 conversion rate is the standard benchmark) and from first purchaser to repeat purchaser within 30 days. ARPU (average revenue per user) and ARPPU (average revenue per paying user) are tracked with player segment breakdowns, whales, dolphins, and minnows, so the monetisation team can see which catalogue items and price points drive each segment. Churn prediction models built on XGBoost use features including session frequency over the last 14 days, current level depth, and spend history to score players by churn risk, enabling retention offer targeting before those players go quiet. GameAnalytics and Amplitude provide comparable economy dashboards as commercial products; the custom build delivers the same capability with economy metrics defined around your specific virtual currency design rather than a generic model.
Live ops event metrics track player participation rates, economy impact, and retention change for each live service event, limited-time modes, seasonal content releases, battle pass launches, and in-game store rotations. Comparing D1 retention in the week following a content release against the baseline from the preceding four weeks tells the live ops team whether the release moved the needle or whether it was consumed and forgotten. Matchmaking quality metrics track skill differential between matched teams (average MMR delta per match), wait time by region and game mode, and match completion versus abandonment rate. Abandonment rate above a threshold often indicates matchmaking quality problems that players express through votes rather than forum posts.
Server performance metrics (latency percentiles, error rates by region) are correlated with player experience signals in the same dashboard so the engineering and ops teams can see whether a latency spike in Southeast Asia corresponds to an abandonment rate increase in that region on the same day. Revenue analytics track LTV (lifetime value) by acquisition cohort so the marketing team can compare LTV against customer acquisition cost by channel. The live service health dashboard gives the operations team a real-time view of the metrics that indicate the game is running normally versus showing early warning signals of a problem. The live service analytics that make operating a live game a monitored system rather than a reactive exercise.
Dashboard design for the specific reports your game team uses regularly: daily health report (D1 retention, DAU, session count, revenue), weekly retention review (D7 and D30 cohort progress, feature adoption), economy balance report (source/sink ratio, ARPU, conversion rate), and live event post-mortem (participation rate, economy impact, retention delta). These reports are built from your event schema and business logic, not a generic template that requires your team to mentally translate generic metrics into game-relevant interpretations.
Scheduled report delivery sends the key metrics to the game team's communication channels on a configured schedule, Slack or email digest each morning, without anyone needing to log into an analytics tool to find out if the game is healthy. Data export allows your analytics team to pull raw event data for ad hoc queries. Integration with BigQuery, Snowflake, or Redshift connects the game analytics data to your existing BI stack if you have one: Looker, Tableau, or Metabase can query the data warehouse directly once the schema is documented. Custom report builder allows game team members to construct their own analyses using a drag-and-drop interface without engineering involvement. The reporting infrastructure that makes game analytics a routine part of the game team's workflow rather than an occasional engineering project.
Commercial analytics platforms handle standard game metrics well: session count, retention by day, and revenue metrics. GameAnalytics provides solid D1/D7/D30 cohort analysis and progression funnel tracking at no cost for smaller event volumes; Amplitude and Mixpanel extend this with flexible event querying. The case for custom analytics is specificity: your game's specific event taxonomy, the specific segments that matter for your design decisions, the specific economy source/sink metrics that reflect your monetisation model, and the specific matchmaking and live ops metrics that commercial platforms don't surface natively.
Custom analytics also means you own the raw event data in your own data warehouse (ClickHouse or BigQuery) rather than depending on a vendor's data retention limits or paying export fees to access your own events. At high event volumes, games generating hundreds of millions of events per day, commercial platform costs scale with ingestion volume in ways that make a custom pipeline economically rational. We give you an honest assessment of whether GameAnalytics or Amplitude would serve you well before scoping a custom build. If the commercial tool fits, we will say so.
The event ingestion pipeline is designed for the peak event volume your target concurrent player count generates, not the average. A game with 100,000 concurrent players generating 10 events per minute per player produces 1 million events per minute at peak, equivalent to roughly 17,000 events per second. This requires Apache Kafka or AWS Kinesis Data Streams at the ingestion layer: both are designed for millions of events per second and decouple the ingest rate from the downstream processing rate using durable partition logs as a buffer.
Asynchronous ingestion with a queue buffer absorbs traffic spikes from live events or a viral moment without backpressure reaching the game API. Real-time aggregation with Apache Flink or Kafka Streams processes the stream as it arrives for dashboards and alerts. The ingestion architecture separates the analytics event path from the game API path so a surge in analytics traffic from a live event cannot affect game server performance. Load testing against the target event volume and a 3x spike scenario is part of the delivery process before launch.
Yes. Game event data can be routed to an existing data warehouse, BigQuery, Snowflake, Redshift, or similar, alongside the custom analytics platform. If you have existing BI tools (Looker, Tableau, Metabase), the analytics data can be exposed to them via the warehouse. The integration approach depends on your existing data stack, which we assess during discovery.
A platform covering event tracking, retention analysis, and funnel reporting typically runs $25,000 to $50,000. A more complete system with economy health monitoring, live service metrics, matchmaking analytics, and a custom reporting layer typically runs $50,000 to $100,000. Fixed cost agreed before development starts.
What clients say
Three-year average engagement. Founders and operators describing the work in their own words. No marketing varnish.

 USA
USAI was pleased with RaftLabs team quality, consistency and execution.
01 / 02
Tell us your game type, the player decisions your analytics needs to inform, and where your current data falls short. We'll scope the right platform and give you a fixed cost.