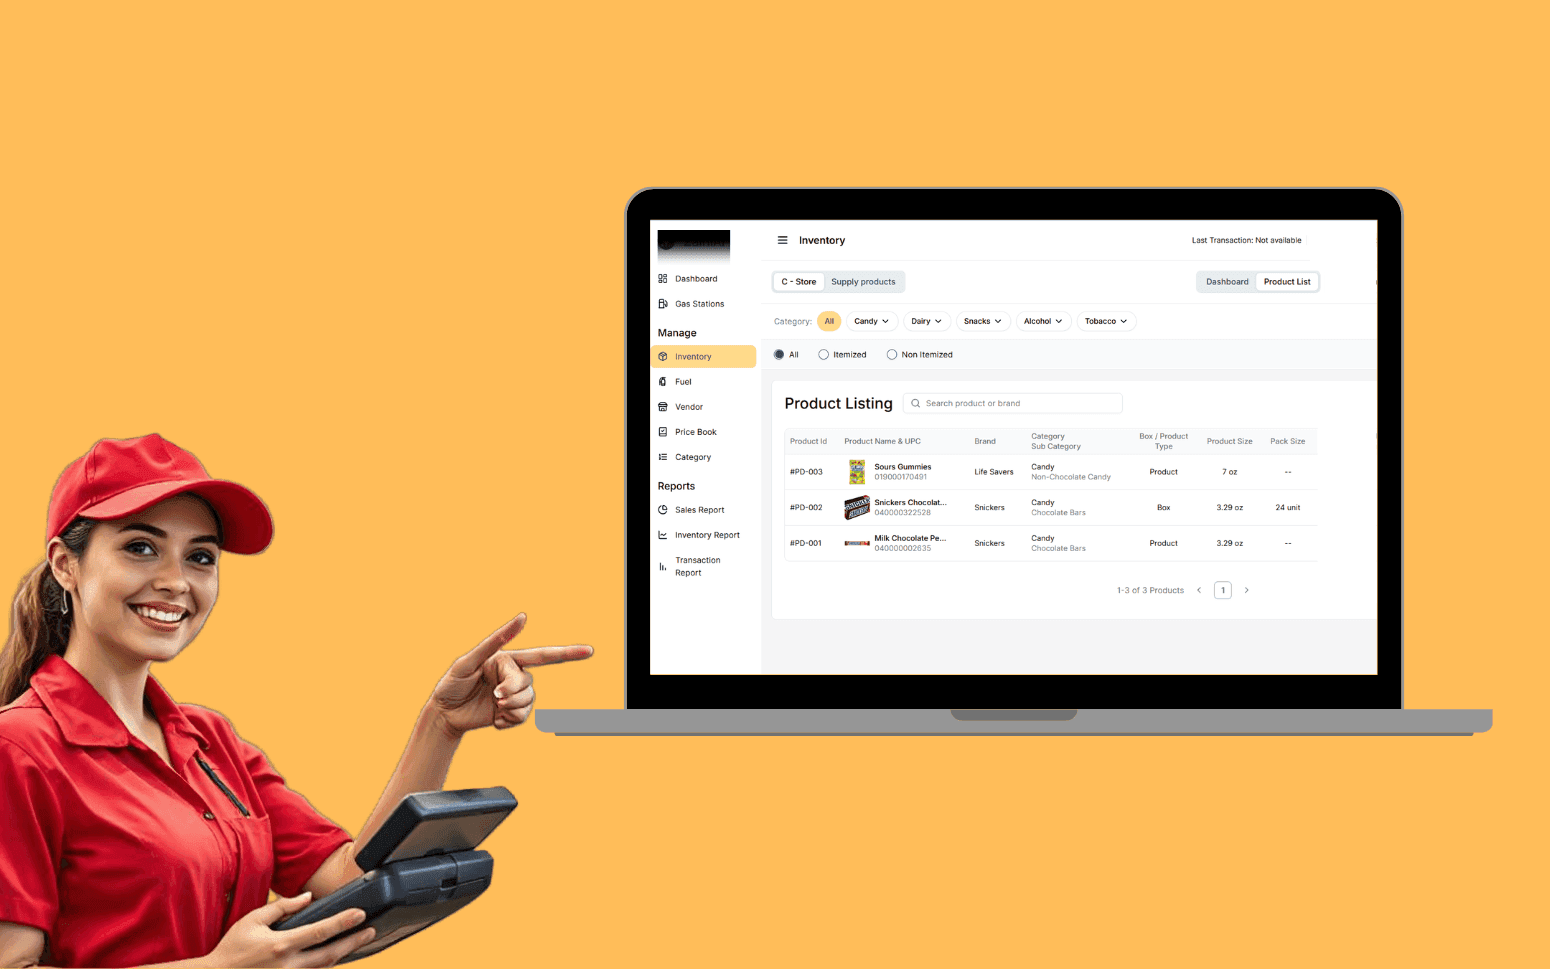
AI OCR Software Scales Gas Station Operations With 20K+ Transactions
- 20K+
- 40+
- 70%
Custom precision agriculture software for large-scale farms, agri-tech companies, and agri-input suppliers who need IoT sensor integration, variable rate application mapping, and crop health monitoring built for the specific data sources and agronomic decisions of their operation.
Generic precision ag platforms support the standard data sources. When you need integration with proprietary sensor hardware, a custom variable rate algorithm specific to your crop and soil type, or a precision ag platform you're building as a commercial product for other farms, custom development is the right approach.
IoT soil sensor and weather station integration across all field sensor hardware in a single operational view
Satellite and drone imagery with NDVI crop health analysis and field-level trend data
Variable rate application map generation from soil sampling, sensor data, and yield history
Irrigation scheduling automation based on soil moisture data and evapotranspiration calculations
Recognition
Soil sensor data from three different manufacturers sitting in three different vendor portals with no way to view all your field data in a single operational dashboard?
Variable rate application maps generated in a desktop tool by an agronomist consultant who visits twice a year, rather than automatically from your own sensor and yield data as conditions change across the season?
In short
RaftLabs builds custom precision agriculture platforms for large-scale farms and agri-tech companies building commercial products for the sector. The platform integrates soil sensors from Sentek, Decagon, Delta-T, and proprietary hardware into a single operational dashboard, processes satellite imagery from Planet and Sentinel-2 for NDVI crop health analysis, generates variable rate application maps in ISO-XML format for John Deere, CNH, AGCO, and Fendt machinery, and automates irrigation scheduling from soil moisture data. Most projects deliver in 12 to 16 weeks at a fixed cost, typically $40,000 to $160,000.
Companies we've built for








Precision agriculture generates more operational data than any other farming approach. Soil moisture readings every 15 minutes from sensors across hundreds of fields, satellite imagery refreshed every five days, drone surveys after every storm, combine yield maps at harvest. The value of that data depends entirely on whether it can be connected and acted on in time to make a difference. A soil moisture alert that arrives after the irrigation decision has already been made manually, or a variable rate map generated from last year's yield data because the current season's soil samples haven't been processed yet, are symptoms of a data platform that hasn't kept up with the sensor investment.
We build the precision agriculture platform that connects your data sources into one operational view and turns that data into the application maps and scheduling decisions that the precision investment was meant to produce. Sensor hardware, imagery, telematics, and laboratory results. We've built IoT data platforms for industrial and field environments across multiple sectors. We understand sensor integration, geospatial data processing, and the agronomic logic behind precision agriculture decisions.
Soil sensor data integration across multiple sensor hardware manufacturers into a single field data platform regardless of the vendor's native data format or API structure. Sentek, Decagon, Delta-T, Irrometer, and proprietary sensor hardware are all supported. Soil moisture, temperature, and electrical conductivity data from multi-depth probe installations is visualised at field and zone level with trend charts showing how conditions are changing over time. Alert threshold configuration for each sensor and each depth sends notifications to the farm manager or irrigation operator when moisture falls below the irrigation trigger point for the relevant crop and growth stage. Sensor health monitoring with connectivity alerts distinguishes between a sensor fault and a connectivity issue when a sensor stops transmitting data. Historical sensor data stored against the field record supports multi-season analysis and calibrating irrigation scheduling models with observed field response data.
Local weather station data integration for operations with on-farm weather monitoring. Rainfall, temperature, wind speed and direction, humidity, solar radiation, and leaf wetness recorded at field level rather than relying on the nearest regional weather station. Evapotranspiration calculation from local weather station data uses the FAO Penman-Monteith method as the primary input for irrigation scheduling and for fungicide timing decisions where temperature and leaf wetness models drive spray timing. Regional forecast data integration supplements local station data for forward-planning decisions. The next seven days of temperature and rainfall probability are displayed alongside the current soil moisture status for each irrigated block. Growing degree day accumulation tracking supports pest and disease models that use heat accumulation to predict risk periods and activity emergence dates.
Satellite imagery integration from Planet, Sentinel-2, and other imagery providers with NDVI, NDRE, and other vegetation index calculations applied at field and zone level for crop health monitoring across the growing season. Temporal NDVI trend analysis shows how crop canopy development compares to the previous season and to the expected development curve for the variety and sowing date. Drone imagery processing for operations conducting their own aerial surveys generates NDVI maps and exports in formats usable by precision application equipment. Anomaly detection within fields identifies areas of crop stress, waterlogging, disease pressure, or pest damage visible in the imagery before they're apparent from ground-level inspection. Imagery archived against the field record for the season keeps historical comparisons available for multi-year analysis and for tracing the source of a yield anomaly identified at harvest.
Variable rate application map generation from the combination of soil sampling data, historical yield maps, current season sensor data, and agronomist recommendations. The data sources your agronomist actually uses rather than a single-input model that ignores most of what you know about each field. Soil sampling data integration from laboratory results with spatial interpolation generates continuous soil property maps from point sample data. Map export in ISO-XML format covers compatibility with the field computers on John Deere, Case IH, AGCO, and Fendt machinery, and shape file format covers precision application companies using their own controllers. As-applied data import from machinery telematics after field operations verifies that the prescribed rates were actually applied and records any deviations from the prescription for the agronomic record. Prescription tracking over multiple seasons builds the relationship between variable rate inputs and yield response for progressive refinement of the application algorithm.
Irrigation scheduling based on soil moisture sensor data and evapotranspiration calculations rather than calendar-based schedules that don't respond to actual crop demand and field conditions. Deficit irrigation model for operations managing water allocations calculates crop water demand against available soil moisture to minimise water use while protecting yield. Irrigation event logging with start time, duration, volume applied, and soil moisture response is recorded against the field record for each irrigation run. Automated irrigation trigger for operations with controllable irrigation systems sends start and stop commands directly to the irrigation controller when soil moisture falls to the trigger threshold. Water use reporting against the water allocation for the season with a running total visible to farm management supports compliance with abstraction licence conditions. Pump station monitoring integration where pump telemetry is available provides fault alerts and flow verification against the irrigation schedule.
Unified operational dashboard displaying all precision agriculture data for the full farm in a single view accessible on desktop and mobile. Soil moisture by field, satellite imagery, current weather and forecast, active alerts, and upcoming irrigation events. Field performance summary by season overlays yield data, input costs, and sensor data to identify the fields and zones where the precision investment is generating the highest return. Agronomist portal for agronomists and crop advisors who need access to the farm's sensor and imagery data without accessing the full farm management system. Data export for third-party agronomic tools in CSV, shape file, and ISO-XML formats covers sensor data, imagery analysis, and application maps for use in Trimble Ag Software, SMS Advanced, or other agronomic planning tools. Year-on-year comparison reports for fields under precision management demonstrate the yield and input cost trends that justify the ongoing sensor and imagery investment.
We integrate with the major soil sensor platforms. Sentek (Drill and Drop, EnviroSCAN), Decagon (now METER Group, including the 5TM and 5TE sensors), Delta-T (EnviroNode), Irrometer (Watermark and Tensiometer), and proprietary sensor hardware developed by agri-tech companies or research institutions. Integration approach depends on how the sensor transmits data. Most modern sensors transmit via cellular, LoRa, or WiFi to a cloud API, and we integrate with that API. For legacy sensors that log to a local data logger, we build a local agent that reads the logger and uploads data to the platform at configurable intervals. For custom or proprietary sensor hardware being developed as part of an agri-tech product, we work directly with the hardware development team to define the data transmission protocol during discovery.
Yes. Variable rate application maps are exported in ISO-XML format, which is the standard supported by most current-generation field computers including John Deere's GreenStar and Operations Center system, CNH's AFS system, AGCO's Fuse system, and Trimble's field computers. For older equipment that uses proprietary map formats, we confirm the specific format required during discovery and build the export accordingly. As-applied data from machinery telematics is imported after field operations to record actual versus prescribed rates. We integrate with the same telematics APIs used for the map export so the round trip from prescription to as-applied record is automated rather than requiring manual file transfer.
Yes. Several of our clients are agri-tech companies building precision agriculture platforms as a commercial product rather than for their own farm. The architecture decisions for a commercial product differ from an internal tool. Multi-tenant data isolation, configurable sensor and imagery integrations that work across different farm setups, a user experience designed for agronomists and farm managers who aren't technical users, and a billing and subscription model for the platform itself. We design for commercial deployment from the start rather than building an internal tool and retrofitting multi-tenancy later. If you're building a precision agriculture platform as a business, the commercial architecture conversation is the first step in discovery.
An IoT data platform integrating soil sensors from up to three hardware manufacturers, a web dashboard with field-level monitoring, and alert notifications typically runs $40,000 to $75,000. Adding satellite imagery integration and NDVI analysis adds $20,000 to $35,000. A full precision agriculture platform including sensor integration, imagery analysis, variable rate map generation, irrigation scheduling, and machinery telemetry integration typically runs $90,000 to $160,000. Agri-tech commercial products with multi-tenant architecture and subscription billing are scoped individually. We price every project at a fixed cost agreed before development starts.
What clients say
Three-year average engagement. Founders and operators describing the work in their own words. No marketing varnish.

 USA
USAAll of the sprints were completed on schedule and on budget. We highly recommend RaftLabs!
01 / 02
Tell us your sensor hardware, imagery sources, machinery fleet, and the agronomic decisions you want the platform to support. We'll scope the right system.