Water Utility Software Development Company

Small and medium water utilities, irrigation operators, and water treatment plant managers are sitting on AMI data they cannot act on, running billing cycles their staff reconcile manually, and managing aging infrastructure through spreadsheets and paper work orders. The gap between the data your meters and sensors collect and the decisions your operations team can make with it is costing you water, revenue, and staff time every week.

  • Smart meter data pipelines that process AMI readings from Badger Meter, Itron, and Sensus endpoints into actionable operational dashboards

  • Leak detection analytics that score pressure and flow anomalies against your network baseline, not generic population thresholds

  • Customer billing portals with self-service usage history, tiered rate calculation, and integrated payment processing

  • Infrastructure asset management with GIS-linked work orders, maintenance scheduling, and condition tracking for pipes, pumps, and treatment assets

3+ years RetentionWeek 1 First milestoneFixed price Pricing

The problem

Sound familiar?

  • Smart meters installed but billing exceptions still reconciled by hand for three days every cycle?

  • Leak detection alerts coming from SCADA but no triage workflow to route them to field crews?

  • Customer complaints about billing accuracy rising because usage data and billing records are in separate systems?

Short answer

RaftLabs builds custom water utility software for small and medium utilities, irrigation operators, and WaterTech businesses: smart meter data management, leak detection analytics, billing portals, and infrastructure asset management. The average utility loses 14% of treated water to non-revenue losses (AWWA). A first module launches as a validated v1 in 10 to 16 weeks from $25,000, and the full platform grows from there at a fixed, agreed cost.

What is water utility software?

Water utility software covers the systems that water utilities, irrigation operators, and WaterTech businesses use to manage meter data, detect leaks, bill customers, monitor water quality, and track infrastructure assets. Water utility software development means building or customizing those systems to fit the specific operational and regulatory requirements of a water service area, treatment plant, or irrigation network.

01 The problem in numbers

What non-revenue water and aging infrastructure cost the sector

Treated drinking water lost across US systems every day (US EPA)
6B gal/day
Average non-revenue water loss at a typical utility (AWWA)
14%
20-year US drinking water infrastructure need (EPA Needs Survey, 2023)
$625B

02 Diagnosis

Problems we solve for water utilities and WaterTech businesses

  1. 01
    Problem

    AMI data arrives but billing exceptions pile up anyway

    Solution

    Utilities that deploy advanced metering infrastructure expect billing accuracy to improve. In practice, the AMI head-end and the billing system are separate platforms with no automated reconciliation layer between them. Readings arrive at 15-minute intervals, but the billing team still exports a CSV each cycle and manually reviews exceptions. At 100,000 endpoints generating 9.6 million readings per day, three days of manual reconciliation per billing cycle is not an oversight. It is a structural gap between data collection and data use.A meter data management layer built between your AMI head-end and billing system automates the reconciliation, flags genuine exceptions for human review, and cuts the billing cycle from days to hours. The team stops chasing data and starts managing the exceptions that actually matter.

  2. 02
    Problem

    Leak detection alerts come from SCADA but no one routes them to field crews

    Solution

    According to the American Water Works Association, the average water utility loses 14% of treated water to non-revenue water losses, primarily leaks. Pressure transients and flow anomalies appear in SCADA as alerts, but without a triage and routing workflow, those alerts go to an operator's screen and stop there. Field crews receive work orders by phone or radio. The gap between a detected anomaly and a crew on site is measured in hours or days, and every hour is water lost, infrastructure deteriorating, and potential damage compounding.A leak detection analytics layer scores anomalies against your network's own pressure and flow baseline. It separates genuine distribution losses from meter errors and planned maintenance draws, then routes confirmed events to field crew work orders in your asset management system. The response gap shrinks and non-revenue water losses drop.

  3. 03
    Problem

    Customers call about billing accuracy because usage and billing data live in separate systems

    Solution

    When a customer disputes a bill, the resolution process requires your billing staff to pull usage data from the AMI system, billing records from the utility billing platform, and payment history from a third system. That is three lookups, often in three different interfaces, before a conversation with the customer can start. The customer experience is slow. The staff experience is frustrating. And the root cause is not the individual bill. It is the absence of a unified customer view.A customer billing portal aggregates usage history, billing records, and payment history into a single interface, then exposes it to customers as self-service. Inbound call volume drops. Your billing team gets the unified view to resolve disputes on first contact rather than the third.

  4. 04
    Problem

    Infrastructure asset condition tracked in spreadsheets and paper work orders

    Solution

    Water utilities managing hundreds of miles of pipe, dozens of pump stations, and treatment assets across a service area cannot track asset condition, maintenance history, and remaining useful life in a spreadsheet. When a pump fails, the maintenance team either knows its history because the right person has been there for 20 years, or they don't. When a pipe segment needs rehabilitation, the prioritization is based on age and known incidents, not condition data. The result is reactive maintenance, unplanned downtime, and capital planning that relies on experience rather than evidence.An infrastructure asset management system links to your GIS, draws from your maintenance work orders, and takes sensor data from your SCADA. Your operations team gets the condition picture to move from reactive maintenance to a planned program. Your capital planning team gets evidence to support rate cases and investment decisions.

03 What we ship

Water utility software we build

  1. Smart meter data management platforms

    AMI meter endpoints from Badger Meter, Itron, Sensus, and Mueller generate consumption, pressure, and diagnostic readings at intervals from 15 minutes to hourly. Without a dedicated meter data management layer, that data sits in the AMI head-end system where only a subset of your team can access it and none of your other operational systems can act on it.

    We build meter data management platforms on AWS IoT Core or Azure IoT Hub with time-series databases designed for the ingestion volume your endpoint count generates. Validation rules flag missing reads, negative consumption, and reverse-flow events for review before data passes downstream. Processed readings feed your billing system, operational dashboards, and leak detection analytics automatically.

    Built for water utilities deploying or expanding AMI programs, irrigation districts managing large metered networks, and WaterTech businesses building a meter data product on top of an AMI network.

  2. Leak detection and non-revenue water analytics

    Generic leak detection tools flag anomalies against population-level pressure and flow thresholds. Your network has its own pressure zones, demand patterns, and seasonal consumption profiles that a generic threshold model misrepresents. The result is alert fatigue: operators stop acting on alerts because most of them are false positives driven by legitimate demand variation, not actual leaks.

    We build leak detection analytics that model your network's baseline from your own SCADA and AMI data, score anomalies against that baseline, and rank leak candidates by confidence and estimated loss volume. Confirmed events generate work orders in your field service or asset management system automatically. Operators review a ranked list of genuine candidates rather than a screen of undifferentiated alerts.

    Built for water utilities with AMI or pressure monitoring infrastructure who need leak detection they can act on rather than more alerts, and for WaterTech businesses building a non-revenue water product.

  3. Customer billing portals and self-service platforms

    Utility billing systems designed for utility operations are rarely designed for customer experience. Usage history requires a phone call. Bill disputes require staff time on both ends. Payment options are limited to what the legacy billing platform supports. And when a customer wants to understand why their bill is higher this month, there is no self-service answer available.

    We build customer-facing billing portals that pull usage history from your AMI system, billing records from your utility billing platform, and payment history from your payment processor into a single customer view. Customers see consumption graphs, compare month-over-month usage, pay online, set up autopay, and receive high-usage alerts before their bill generates. Staff resolve disputes in the portal without switching systems. Integration with Stripe or your existing payment gateway handles PCI DSS-compliant payment processing.

    Built for water utilities that want to reduce inbound call volume and improve customer satisfaction scores without replacing their core billing platform.

  4. Water quality monitoring dashboards

    Water treatment plant operators and distribution system managers need to know when water quality parameters move outside acceptable ranges before a compliance breach or a public health event. Sensor data from turbidity meters, chlorine analysers, pH sensors, and flow meters arrives in SCADA. What is missing is the contextual layer: trend analysis, regulatory limit tracking, predictive alerts, and the reporting format your state drinking water program requires.

    We build water quality monitoring dashboards that aggregate sensor data from your SCADA or directly from data loggers, display parameter trends against EPA Safe Drinking Water Act limits and your own operational targets, generate automated compliance reports for state primacy agencies, and alert operators when a parameter is trending toward a limit before it breaches. Integration with Hach WIMS or standalone sensor networks via Modbus and OPC-UA is supported.

    Built for water treatment plant operators, small municipal water systems, and environmental monitoring businesses that need compliance-ready water quality reporting without a full SCADA upgrade.

  5. Infrastructure asset management systems

    Pipes, pumps, valves, treatment equipment, and meters are the physical assets your utility runs on. Without a system that tracks their location, condition, maintenance history, and replacement cost in one place, capital planning is intuition and reactive maintenance is the norm.

    We build infrastructure asset management systems that link to your Esri ArcGIS or open-source GIS for geographic asset records, integrate with your SCADA for sensor-derived condition data, and manage the work order lifecycle from preventive maintenance scheduling through to completion and cost capture. Asset condition scoring based on age, material, maintenance history, and operational data drives a prioritized rehabilitation list your capital planning team can take to a rate case with confidence.

    Built for water utilities moving from reactive to planned asset management, wastewater operators tracking treatment equipment condition, and irrigation districts managing large networks of pumps and distribution infrastructure.


  6. Irrigation management and control software

    Irrigation management for districts, farms, and large commercial sites requires scheduling, flow monitoring, and water accounting that general-purpose SCADA cannot deliver without significant customization. Crop water demand changes daily with temperature and evapotranspiration. Allocations must be tracked against water rights. And field crews need mobile access to valve status and flow readings without driving to a control panel.

    We build irrigation management platforms that integrate with soil moisture sensors, weather API data, and flow meter telemetry to drive demand-based irrigation scheduling. Water accounting tracks diversions against allocation balances in real time. Field crew mobile apps give valve control and flow reading access without requiring a trip to the pump station. Reporting covers allocation reporting for water rights compliance and conservation program reporting for state agencies.

    Built for irrigation districts managing large canal and pipe networks, commercial agricultural operations with precision irrigation requirements, and water authorities managing recycled water distribution systems.

04 Scope and cost

How a water utility build is scoped, phased, and priced

We start with the one module that pays for itself first, prove it in production, then expand. The band below is what each phase runs at a fixed price agreed before development starts.

Phase 1: first module

Customer billing portal

The smallest slice that returns value on its own: self-service usage history, tiered rate calculation, online payments, and high-usage alerts, integrated with your existing AMI and billing systems without replacing either.

  • 10-16 weeks to a validated v1
  • $25,000-$55,000, fixed
  • Cuts inbound billing-dispute calls first

Phase 2: operations platform

Meter data and leak analytics

AMI ingestion at your endpoint volume, validation rules for missing and reverse-flow reads, and leak scoring against your own SCADA and pressure baseline that routes confirmed events to field work orders.

  • 14-22 weeks
  • $45,000-$90,000, fixed
  • Targets the 14% non-revenue water loss (AWWA)

Phase 3: full platform

End-to-end utility management

Billing, GIS-linked asset management, water quality compliance reporting, and operational analytics on one data layer. Scoped in discovery because integration complexity, not feature count, drives the number.

  • Scoped in discovery
  • Grows from the phases above
  • One data layer across billing, assets, ops
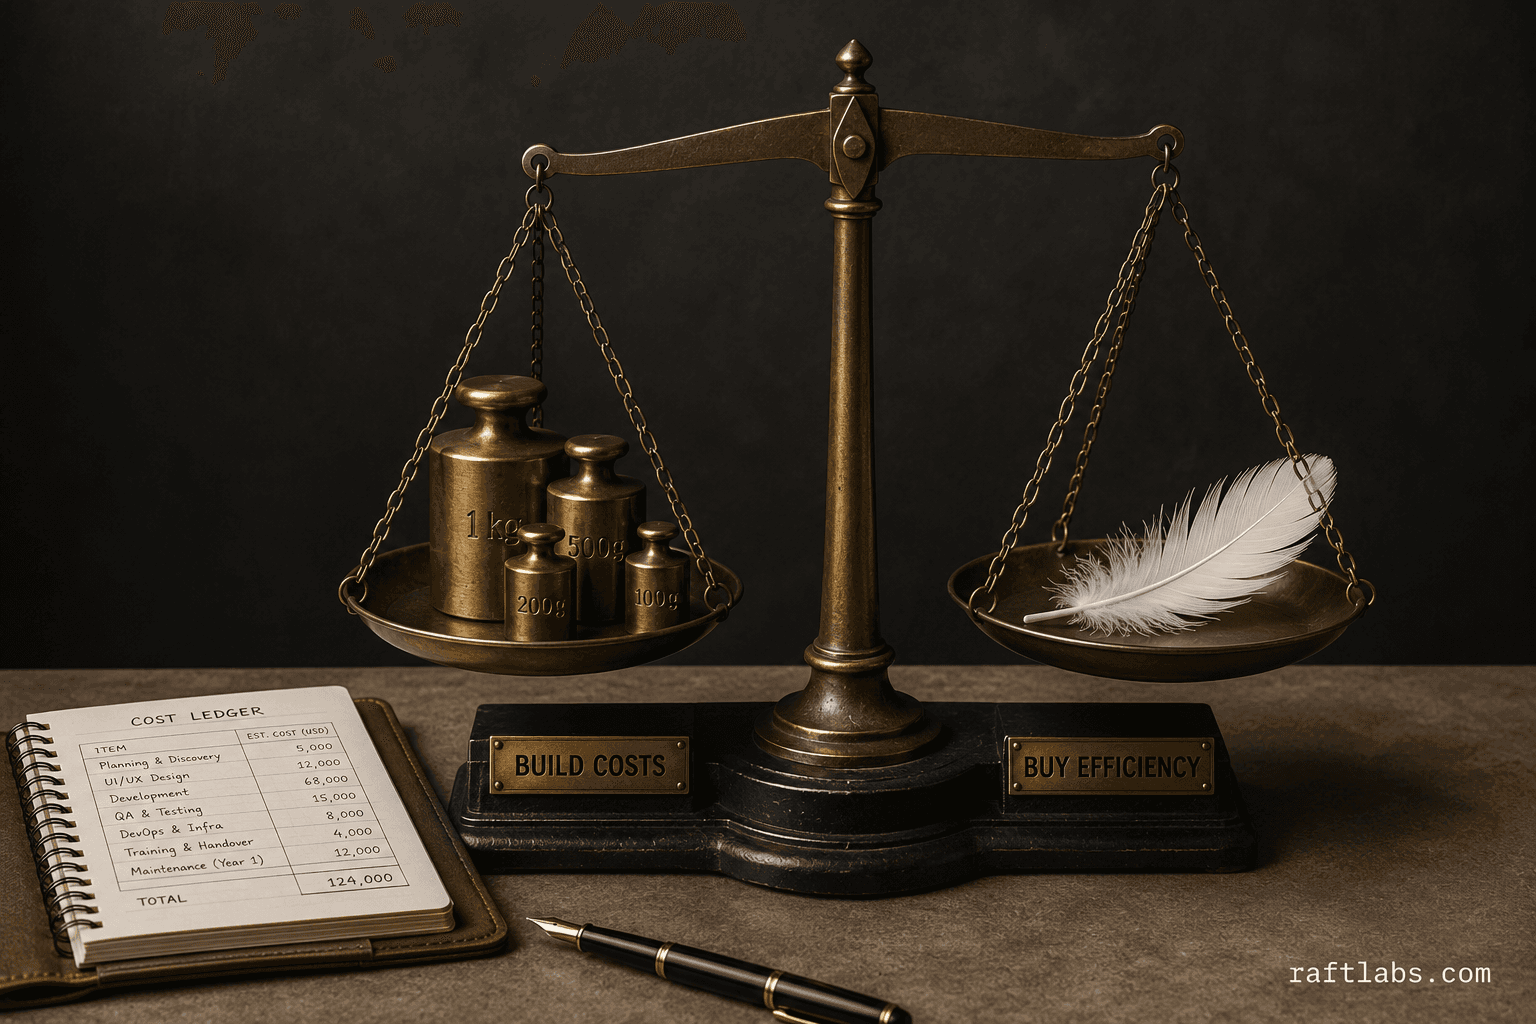
A single focused module often costs less over three years than a full off-the-shelf platform license and its implementation. We scope both options in discovery so you can compare before committing to either.

05 How we work

How we build water utility software

  1. 01

    Discovery and integration audit

    Two to three weeks mapping your existing systems: your AMI head-end platform and API capability, your SCADA version and connectivity options, your billing system and data model, and your GIS platform. Water utility software projects fail most often at the integration layer. A 15-year-old SCADA system may require custom middleware that nobody budgeted for, and an AMI head-end may expose less data via its API than the vendor documentation suggests. We confirm what your systems actually expose before scoping a single feature, so the fixed-cost agreement reflects reality, not assumptions.
  2. 02

    Data model and architecture

    We design the data architecture around your operational requirements: the time-series data model for meter readings, the network model for leak detection spatial analytics, the customer data model for the billing portal, and the asset hierarchy for infrastructure management. Integration points with your SCADA via OPC-UA or Modbus, your AMI head-end via its REST API, and your GIS platform are prototyped in the first two weeks of build because they carry the highest delivery risk.
  3. 03

    Build and operational review

    Two-week sprints with working software at each checkpoint reviewed by your operations team, not just your project sponsor. Water utility software that passes a technical review but fails an operator usability review gets reworked after go-live, which costs more than building it right. Field crew mobile workflows, operator alert interfaces, and billing team dispute resolution flows are reviewed with the people who will use them at every sprint, not at the end.
  4. 04

    Go-live and handover

    Phased rollout starting with a controlled district or meter zone before full network activation. Monitoring covers data ingestion rates, API latency to connected systems, and alert delivery times. Your operations team receives training on the platform. Documentation covers the data flow architecture, integration configuration, and the alert rule set so your team can tune it as your network changes after we hand over.

Trusted by

Vodafone logo
Aldi logo
Nike logo
Microsoft logo
Heineken logo
Cisco logo
Calorgas logo
Energia Rewards logo
GE logo
Bank of America logo
T-Mobile logo
Valero logo
Techstars logo
East Ventures logo
TuneClub logo

06 Track record

What water utilities get when they work with us

Weeks to a validated v1 first module, then iterate
10-16
Non-revenue water loss addressable by leak analytics (AWWA)
14%
Building production software for industrial and infrastructure sectors
Since 2015
Cost, agreed before development starts
Fixed

07 Why us

Why choose us?

  • 01
    We've seen your problem before
    Across dozens of industries and 100+ products, we recognise your situation fast, then frame the fix around your margin and your operations, not a generic template.
  • 02
    We own the number, not the ticket
    We measure success the way you do: hours saved, revenue earned, margin recovered. We stay through launch and growth, so the result is ours to own.
  • 03
    Serious businesses trust us
    Vodafone, T-Mobile, Cisco, Energia, Aldi, Nike. Building since 2015, 100+ products in production. Serious businesses keep coming back because we stay accountable long after launch.

08 Questions

Frequently asked questions

Yes. Building the analytics, billing, and customer-facing layer on top of your existing SCADA is the most common engagement pattern we see with small and medium utilities. We connect to your SCADA via OPC-UA, Modbus, or REST APIs depending on the platform version, pull operational data into a separate data layer, and build the dashboards, alerts, and workflows your team needs without touching the control system itself. Integration complexity is scoped during discovery based on your SCADA version and what it exposes.

Yes. At 100,000 meter endpoints reading at 15-minute intervals, you generate roughly 9.6 million readings per day. We architect meter data management systems on AWS IoT Core, Azure IoT Hub, or Google Cloud IoT with time-series databases designed for that ingestion rate. Processing and querying that volume without performance degradation is a design requirement we confirm during discovery, not a problem we solve after go-live.

A customer billing portal with self-service usage history and payment processing takes 10 to 16 weeks and costs $25,000 to $55,000. A smart meter data management and leak detection analytics platform runs 14 to 22 weeks and $45,000 to $90,000. An end-to-end utility management system covering billing, asset management, and operational analytics is scoped separately based on integration complexity. All projects are fixed cost, agreed before development starts.

Yes. Asset management for water utilities without GIS integration is just a spreadsheet with extra steps. We integrate with Esri ArcGIS and open-source QGIS to link pipe, pump, and treatment asset records to their geographic locations, so your maintenance team sees work orders on a map and your operations team can visualize pressure zones and confirmed leak locations in context. GIS integration scope and data model are confirmed during discovery.

We build against the common integration standards in WaterTech: OPC-UA and Modbus for SCADA connectivity, WaterML and WaterOneFlow for hydrological data exchange, REST APIs for AMI head-end systems from Itron, Badger Meter, Sensus, and Mueller, and Esri ArcGIS APIs for GIS integration. Compliance with EPA Safe Drinking Water Act reporting requirements and state-specific water quality regulations is scoped as a data and reporting requirement during discovery.

Custom software makes sense when a specific operational gap, such as AMI-to-billing reconciliation, leak detection triage routing, or a customer self-service portal, cannot be solved by configuring an off-the-shelf platform without significant compromise or integration workarounds. For a single focused problem, a custom solution in the $25,000 to $55,000 range often costs less than a full platform license and implementation over a three-year period. We scope both options during discovery so you have the comparison before committing to either approach.

Ready to build your water utility software?

Tell us what you are building, what systems it needs to connect to, and where your current tools fall short. We will scope it out together.

  • Scope and cost agreed before work starts. No surprises. No obligation.
  • Working prototype within 3 weeks of kickoff.
  • Pay by milestone. You see progress before each invoice.
  • 60-day post-launch warranty. Bug fixes, UI tweaks, and deployment support. No retainer.
  • All conversations are NDA-protected.

Stay on topic

More on custom software