Industrial IoT Software Development

Industrial IoT software development, built on the data your plant already generates

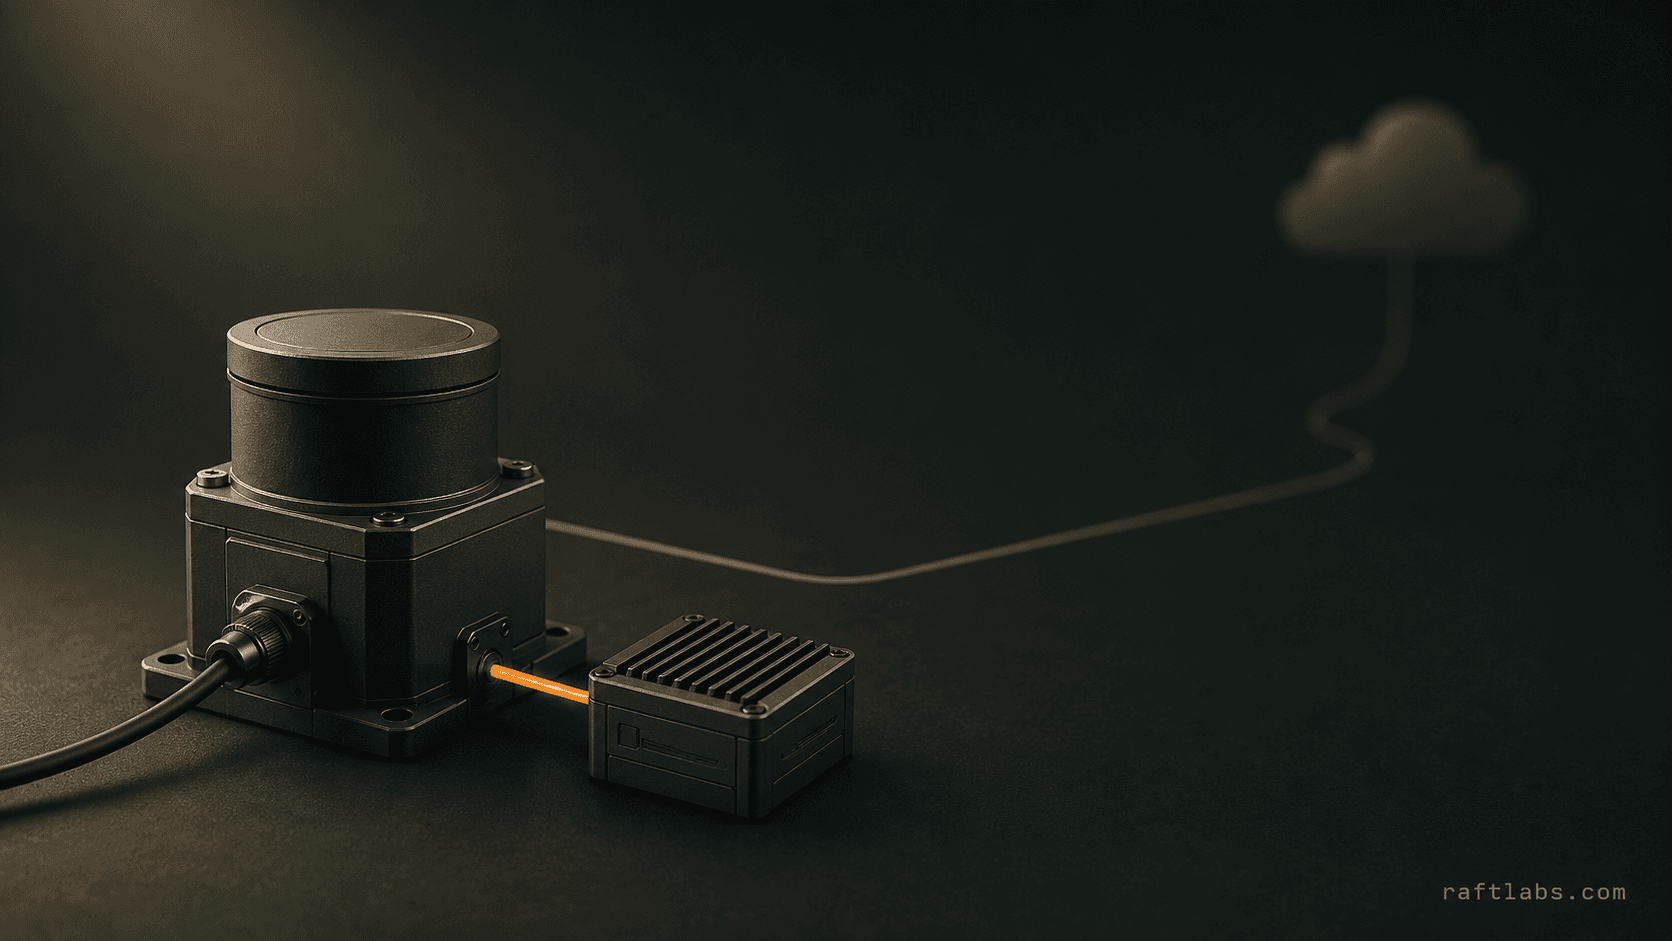
Modern manufacturing equipment generates more data than most plants know what to do with. PLCs log cycle counts and fault codes, sensors measure temperature and vibration, SCADA systems record process variables by the second. Almost none of that data reaches the people who could act on it. IoT machine monitoring software doesn't add sensors to your machines. It connects what already exists to a system that makes the data usable: live OEE, automated downtime tracking, and the condition data that feeds predictive maintenance.

  • OPC-UA, MQTT, and Modbus TCP connectivity to PLCs, SCADA systems, and industrial sensors across your plant

  • Real-time OEE dashboards showing availability, performance, and quality per machine, line, and shift

  • Automated downtime detection with operator reason code capture and MTBF/MTTR reporting

  • Condition trend monitoring feeding your predictive maintenance system and CMMS work order creation

Recent outcomes

Voice AI · Research

6× deeper insights

Text-based interviews converted to automated phone calls

AI Automation · Ops

20k+ txns day one

Manual invoice OCR across 40+ gas stations

Loyalty · Retail

1,062 users in 4 weeks

SuperValu & Centra loyalty platform with receipt validation

SaaS · Logistics

2,000+ shipments yr 1

Multi-carrier shipping hub for Indonesian eCommerce

4.9
on Clutch
See our work

The problem

Sound familiar?

  • Plant managers walking the floor to find out which machines are running because there is no live visibility system?

  • OEE calculated manually from shift reports a day after the shift ends, when it's too late to act?

Short answer

Industrial IoT software development connects a manufacturer's existing PLCs, SCADA systems, and sensors via OPC-UA, MQTT, and Modbus TCP to real-time OEE dashboards, downtime tracking, and predictive-maintenance data. RaftLabs builds these platforms so plant managers get live visibility into machine availability and performance without manual data collection. A first monitored line launches in 10 to 16 weeks at a fixed cost.

Key takeaways

  • OEE is calculated continuously from live machine signals and operator inputs, not manual shift reports, as availability x performance x quality.
  • Downtime clocks start automatically from machine signals, with operators prompted only for the reason code, producing accurate MTBF/MTTR per machine and failure mode.
  • Older machines without digital interfaces can be monitored via low-cost I/O modules on existing relays, avoiding a full instrumentation retrofit.
  • A first monitored line or cell, connectivity plus a live OEE dashboard, starts around $25,000; a full single-plant rollout grows to $60,000, and multi-site expansion costs less per site once the platform exists.

Trusted by

Vodafone logo
Aldi logo
Nike logo
Microsoft logo
Heineken logo
Cisco logo
Calorgas logo
Energia Rewards logo
GE logo
Bank of America logo
T-Mobile logo
Valero logo
Techstars logo
East Ventures logo
TuneClub logo

Proof

Since 2015
shipping production software across healthcare, fintech, hospitality, and logistics
RaftLabs delivery record
4.9/5
average client rating on Clutch
Clutch, verified reviews
Fixed price
scope and cost agreed in writing before any development starts
Every RaftLabs engagement

IoT machine monitoring built on the signals your plant already generates

Industrial IoT software development turns the signals your plant already generates into live OEE, downtime, and condition data. RaftLabs connects your existing PLCs, SCADA systems, and sensors, then works with your engineering team to understand your equipment, protocols, and network topology. We design the integration layer to fit your environment: edge computing where bandwidth or latency makes cloud-first impractical, direct connectivity where the infrastructure allows it.

The payoff is not just visibility. The same condition data feeds predictive maintenance, which reduces equipment breakdowns by up to 70% and maintenance costs by roughly 25% (Deloitte). Capturing it cleanly from day one is what turns a monitoring dashboard into a system that prevents failures instead of just reporting them.

Capabilities

What we build

  • 01
    PLC and SCADA connectivity

    Data normalisation across heterogeneous machine protocols into a single model, with edge computing nodes where bandwidth or latency requires local processing.

    Built with
    OPC-UA · MQTT · Modbus
  • 02
    Real-time OEE dashboards

    Availability, performance, and quality calculated continuously per machine, line, and shift, accessible on any device with configurable targets per asset.

  • 03
    Downtime tracking and alerting

    Automatic downtime detection from machine signals with operator reason-code capture, and MTBF/MTTR reporting per machine and failure mode.

  • 04
    Predictive maintenance integration

    Trend monitoring on vibration, temperature, and cycle-time drift feeding automated CMMS work order creation.

    Built with
    SAP PM · Maximo
  • 05
    Energy and utilities monitoring

    Consumption tracked per machine and production area with anomaly detection for equipment drawing above-normal power.

  • 06
    Multi-site monitoring and reporting

    Consolidated OEE, downtime, and energy reporting across plants with normalised data regardless of PLC vendor or protocol mix.

How we work

From scope to live monitoring platform

  1. Week 1
    01

    Equipment and protocol scoping

    We map your equipment types, existing protocols, and the visibility gaps you're missing. You leave week 1 with a written scope document and a fixed-price quote.

  2. Weeks 2-5
    02

    Connectivity and data model design

    Protocol mapping, edge computing needs, and OEE calculation logic designed against your actual plant.

  3. Weeks 6-14
    03

    Build and integrate

    Connectivity, dashboards, and downtime tracking built in parallel, validated against real machine data.

  4. Final 2-3 weeks
    04

    Launch and team rollout

    Plant managers and maintenance teams trained on the dashboards before full rollout.

Why us

Why manufacturers choose RaftLabs

  • 01
    Senior engineers build what they scope

    The engineers who assess your equipment also build the solution. No bait-and-switch, no offshore handoff after the contract is signed.

  • 02
    Fixed price before development starts

    We scope the work, calculate the cost, and lock it in writing before any development starts.

  • 03
    Shipping production software since 2015

    Clients include Vodafone, T-Mobile, Aldi, Nike, Cisco, and Lockheed Martin. We build data-heavy platforms where reliability and clean integration matter.

  • 04
    No integration surprises during build

    Connectivity approach for every machine type is documented during discovery, not discovered mid-project.

  • 05
    Built as the foundation for predictive maintenance

    The condition data captured is designed to feed failure-prediction models from day one.

Have an IoT monitoring project?

Tell us your equipment types, existing protocols, and what visibility you're missing. We'll design the integration and give you a fixed cost.


Stay on topic

More on manufacturing & energy

Frequently asked questions

We work with OPC-UA, MQTT, Modbus TCP, and REST APIs as the primary connectivity methods. OPC-UA is preferred for modern equipment as it carries rich metadata alongside process values. MQTT works well for high-frequency sensor data. Modbus TCP covers the large installed base of older PLCs. For machines that pre-date digital interfaces, we assess whether signals such as motor run status or fault relay outputs are accessible and design an I/O bridge accordingly.

Overall Equipment Effectiveness is the product of availability, performance, and quality. The software calculates each component from live machine signals and operator inputs rather than manual shift reports, so the number is current and accurate rather than a day-late calculation.

IoT monitoring provides the data layer that predictive maintenance models run on. The monitoring platform captures and stores time-series condition data per machine. Predictive models are trained on that historical data to identify patterns preceding specific failure modes, then run against the live data stream to flag when a machine's condition is trending toward failure.

Yes. The monitoring layer is designed to feed and read from the systems you already run. We push production counts and downtime events up to MES and ERP, and open work orders in a CMMS such as SAP PM or IBM Maximo when a condition threshold is crossed. The normalised data model also serves as the foundation for a digital twin if you plan to simulate line changes later.

We scope in phases. A first monitored line or cell, covering connectivity and a live OEE dashboard, starts around $25,000. A full single-plant rollout with downtime tracking, alerting, and predictive-maintenance data grows to about $60,000, depending on the number of machines, the protocol mix, and whether edge computing is needed. Multi-site expansion after the first plant costs less per site.

Work with us

Tell us what you need. We'll tell you what it would take.

We scope IoT Integration and Machine Monitoring Software in 30 minutes. You walk away with a clear cost, timeline, and approach. No commitment required.

  • Scope and cost agreed before work starts. No surprises. No obligation.
  • Working prototype within 3 weeks of kickoff.
  • Pay by milestone. You see progress before each invoice.
  • 60-day post-launch warranty. Bug fixes, UI tweaks, and deployment support. No retainer.
  • All conversations are NDA-protected.