The two days after close that never make it into anyone's plan.
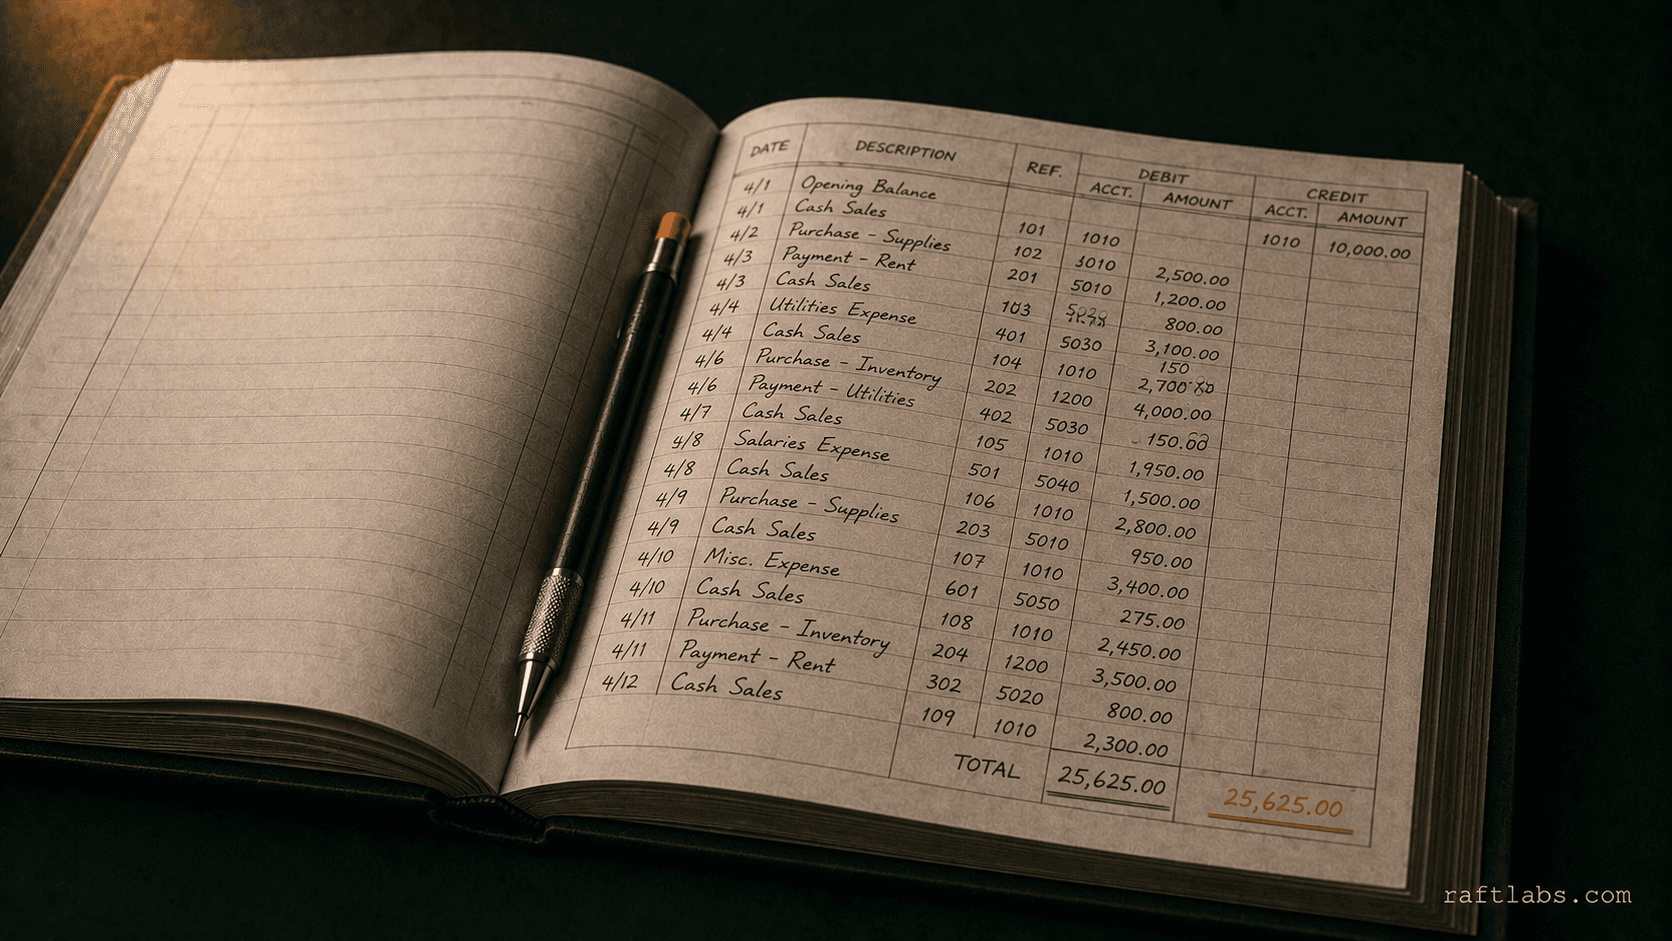
The numbers are final on day one. Then the CFO opens Excel. Two days rebuilding the board pack: pulling the P&L, the balance sheet, and the cash flow, reformatting it into the layout the board actually reads, keying the consolidated view the accounting platform cannot produce.
The numbers were never the problem. The report was. Every month, the same two days, spent turning correct figures into a document someone can actually use.
Custom financial reporting software closes that gap. The report runs from the ledger, in the board's format, on the day the numbers land.
The problem isn't that the numbers are wrong, it's that getting them into the format stakeholders actually use requires a manual step that takes one to three days every month. Finance teams feel this industry-wide: half still take six or more business days to close the books each month, and only 18% close in three days or fewer (Ledge / CFO.com, 2025). The report assembly sits on top of that. Custom financial reporting software closes the gap: the report runs directly from ledger data, in the required format, with drill-down from summary figure to supporting transaction available in one click.
RaftLabs has been shipping production software since 2015, with fintech products live in payments and investment data. The team that scopes your reporting gap is the team that builds it, at a fixed cost agreed before development starts, and the board pack is ready on day two or three of close because the manual assembly step is gone. Consolidation logic handles groups of two entities or twenty-five, with changing ownership percentages, mixed exchange rates, and mid-period entity changes, on a GAAP or IFRS basis.
This pays off when the close is controlled and the report still takes days.
Everything on the left should already be true for your finance team. Even one thing on the right, and your accounting platform's built-in reports are the smarter starting point right now.
A fit01A month-end close that's well-controlled, but the board pack still takes two to five days of Excel work after the numbers are final.
02Consolidation across multiple legal entities, or subsidiaries on different platforms like QuickBooks, Xero, Sage, or SAP.
03Regulatory or statutory reporting you currently reformat by hand into the regulator's template every period.
Not a fit01Your accounting platform's built-in reports already give stakeholders the format they need.
02The close itself isn't controlled yet, so the numbers aren't reliable to report from.
03A one-off report you need once, not a recurring pack produced on a defined schedule.
P&L, balance sheet, and cash flow produced directly from the ledger in your board's exact layout, with prior period comparisons, segment reporting by division or cost centre, and narrative commentary fields built into the same pack. Every figure reconciles back to the underlying double-entry ledger, so the pack ties out to the trial balance without a manual check.
A consolidation engine aggregates subsidiary trial balances with automatic inter-company elimination and minority interest calculation on a GAAP or IFRS basis, retaining full consolidation workings and a posting-level audit trail so every figure can be reviewed, traced to source, and explained line by line.
03Budget vs actual variance reporting
Budget loading with phasing rules drives variance reporting against current period and year to date, with forecast management, variance commentary capture, and drill-down to individual transactions available throughout the period.
Dashboards configured to your specific metrics, revenue, margin, EBITDA, debtor days, calculated directly from ledger data with trend charts and target lines, scoped for non-finance stakeholders where relevant.
VAT figures, statutory accounts schedules, and corporation tax working papers populate from the ledger automatically, with filing deadline tracking and alerts so nothing is missed in a busy close period.
06Report scheduling and distribution
Reports run on a defined schedule, board pack on day three, weekly cash position every Monday, with automated distribution to defined recipients, versioning, and delivery confirmation.
Have a financial reporting project?
Tell us the reports your stakeholders need, the format they use, and how long your team spends producing them today. We'll scope the reporting system that removes the manual step.
How it works
From scope to live reporting system
- Week 1
01Reporting requirements scoping
We map your stakeholder reports, current close process, and data sources. You leave week 1 with a written scope document and a fixed-price quote.
- Weeks 2-4
02Data model and consolidation design
Account mapping, consolidation logic, and report layouts designed against your actual chart of accounts.
- Weeks 5-11
03Build and integrate
Ledger integration, report engine, and distribution built in parallel, tested against real close data.
- Final 2-3 weeks
04Launch and finance team training
Finance team trained on the reporting workflow ahead of the next real close.
We scope the work, calculate the cost, and lock it before development starts. Where you land in that range depends on scope, not negotiation:
- Focused build, $35,000-$70,000
- Management accounts, budget vs actual reporting, and a KPI dashboard, produced directly from the ledger.
- Full build, $70,000-$130,000
- Everything in the focused build, plus group consolidation, regulatory reporting, automated distribution, and multi-source data integration.
What it costs
Custom financial reporting software, starting at $35,000.
Management accounts, consolidation, budget vs actual, and regulatory reporting, produced directly from your ledger on a defined schedule.
Most finance teams start with the board pack alone. Consolidation and regulatory reporting get added once the first report set is live and the board has seen it.
Starting investment
Starts at $35,000
Most teams launch a validated v1 in 10 to 14 weeks, then keep building. Start with the board pack, then add consolidation and budget-vs-actual once the first phase is running.
No hourly billing
Once we scope the reporting build, that price is locked in writing, no surprise invoices, no change fees you didn't agree to.
Runs from the ledger
Reports run directly from your ledger data on a defined schedule, so the board pack is ready on day two or three of close, not rebuilt in Excel on day ten.