

Data Analytics Services

You have data in five different systems. None of them talk to each other. Nobody in the business can answer a basic question without spending a day pulling it together.

Your ops team is running on two-week-old spreadsheets. Your engineers spend 30% of their week writing one-off SQL reports because no one built a proper analytics layer. You hired a data analyst six months ago and they're still waiting for clean data to analyse.
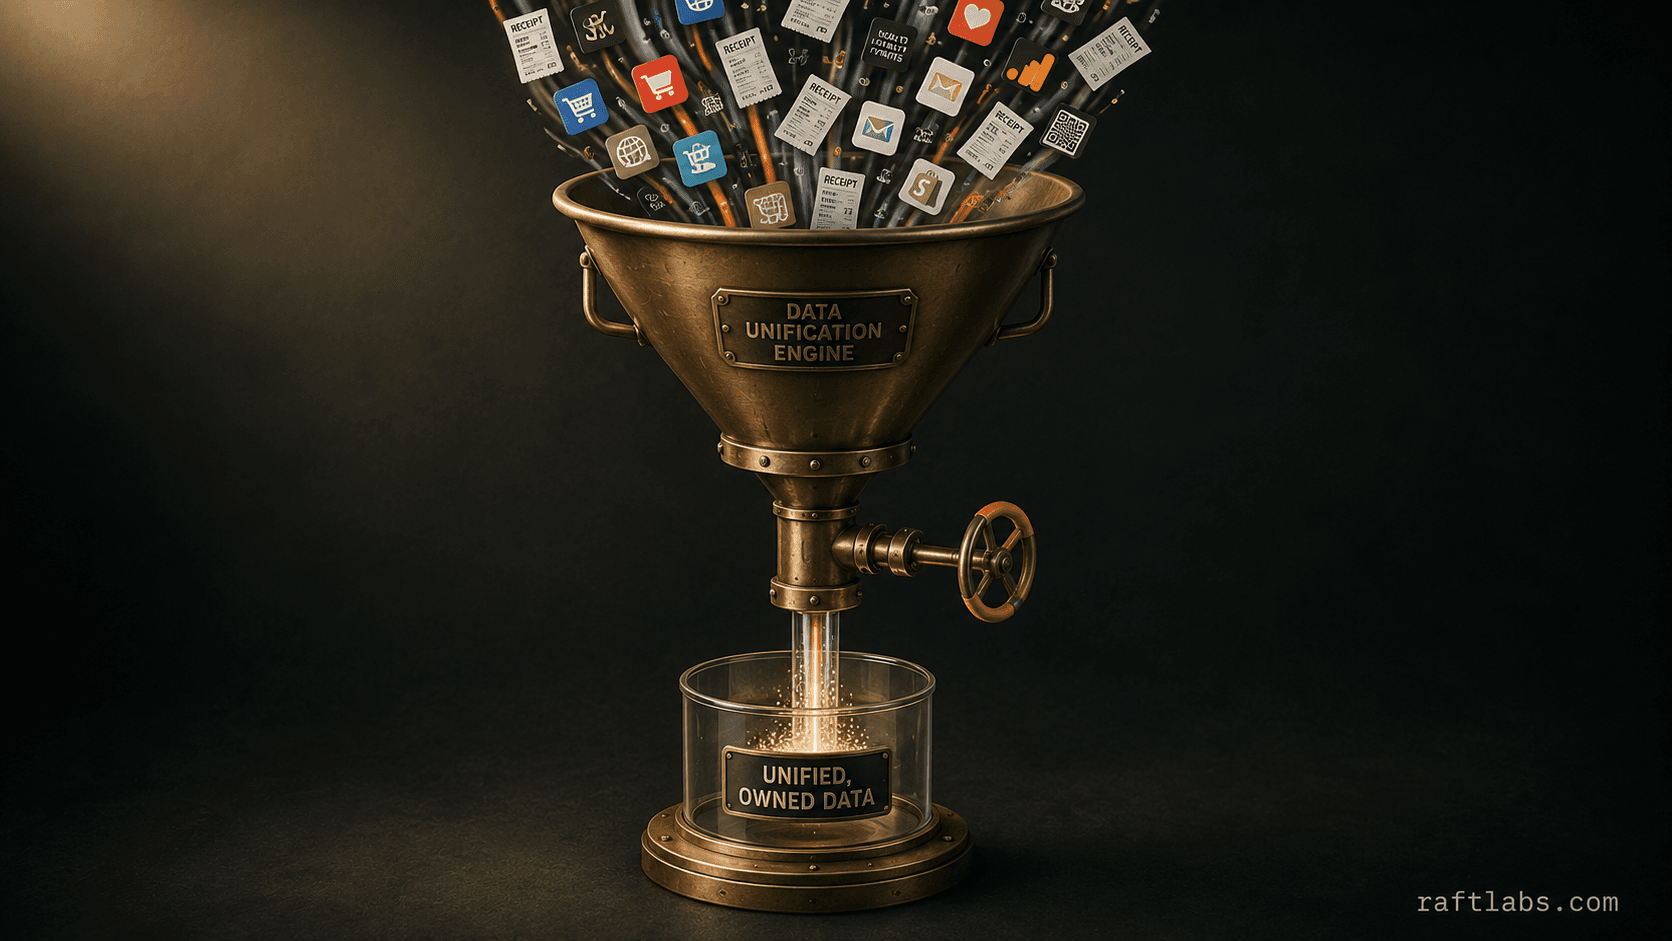
We build data analytics systems that fix this. Pipelines that pull from every source you use, a warehouse that stores it cleanly, and dashboards your team can actually open on Monday morning and trust. Most projects complete in 6-10 weeks.

  • Data from multiple sources unified into one analytics layer

  • Dashboards your ops team can actually use - not demos they forgot how to run

  • 6-10 weeks from scattered data to working analytics

Recent outcomes

Data analytics · E-commerce operations

0% manual reconciliation

Unified order, inventory, and CRM data from 4 systems into a single BigQuery warehouse with live ops dashboards.

Revenue analytics · B2B SaaS

80% faster reporting

Built MRR/ARR tracking pipeline with cohort analysis across CRM and payment data. Finance team cut reporting time by 80%.

Operational analytics · Retail

< 1 hour data lag

Delivered fulfilment and support dashboards for ops team of 40 people. Data lag reduced from two weeks to under one hour.

4.9
on Clutch
See our work

The problem

Sound familiar?

  • Your data lives in five different systems and no one can see the full picture without spending a day pulling it together?

  • Your engineers spend half their week writing SQL reports that someone could've built once and automated?

  • You hired a data analyst but they're still waiting for clean data to analyse six months later?

Short answer

RaftLabs builds data analytics systems for businesses across the US, UK, Europe, Canada, GCC, South Africa, and Southeast Asia. We connect your CRMs, ERPs, and databases into one warehouse, then deliver dashboards your ops team trusts. Most projects complete in 6-10 weeks at a fixed price. 100+ products shipped since 2015.

Key takeaways

  • Most data analytics projects complete in 6-10 weeks at a fixed price.
  • RaftLabs has shipped 100+ software products since 2015 for clients in the US, UK, Europe, Canada, GCC, South Africa, and Southeast Asia.
  • One e-commerce client unified data from 4 systems into a single BigQuery warehouse, eliminating manual reconciliation entirely.
  • A B2B SaaS client cut finance reporting time by 80% after RaftLabs built an MRR/ARR tracking pipeline with cohort analysis.
  • A retail client reduced data lag from two weeks to under one hour with custom fulfilment and support dashboards.
  • Pipelines, warehouse setup, and dashboards are delivered by one team in that order — the pipeline is built and validated before any dashboard is built on top.

Trusted by

Vodafone logo
Aldi logo
Nike logo
Microsoft logo
Heineken logo
Cisco logo
Calorgas logo
Energia Rewards logo

Software delivery, by the numbers

software products shipped
100+
average time to first production release
12 weeks
rated by clients on Clutch
4.9/5
years delivering software for established businesses
9+

RaftLabs provides data analytics services for businesses whose data lives in too many places to be useful. We've built analytics systems for clients including Aldi and Vodafone, connecting CRMs, ERPs, databases, and APIs into a single layer that ops teams can actually open on a Monday morning and trust. We're a tech studio, not a BI consultancy that hands you a slide deck and leaves. One team builds the pipelines, configures the warehouse, and delivers dashboards your finance, ops, and product teams use daily.

Most businesses have more data than they know what to do with. What they don't have is a single place where it all makes sense. The CRM tracks leads but not revenue. The ERP has revenue but not fulfilment time. The ops spreadsheet has fulfilment time but it's two weeks old and was assembled manually by someone on a Friday afternoon.

We fix the data layer first - pipelines, warehouse, data model - then build the dashboards and reporting on top. In that order.

Analytics services

What we build

  • 01

    Data pipeline development (ETL/ELT)

    Pipelines that extract data from your source systems, transform it into a consistent shape, and load it into a central warehouse. Built on dbt for transformation logic so your business rules are version-controlled code, not queries someone ran once and forgot. Source connectors for CRMs, ERPs, databases, REST APIs, spreadsheets, and event tracking platforms. Incremental loading so pipelines run in minutes, not hours. Error handling and alerting so broken source data surfaces immediately rather than silently corrupting your dashboards.

  • 02

    Data warehouse setup

    Warehouse configuration in BigQuery, Snowflake, Redshift, or Postgres depending on your data volume, query patterns, and cloud provider. Schema design that models your business concepts cleanly - fact tables for events (orders, transactions, sessions), dimension tables for entities (customers, products, regions). Partitioning and clustering configured for your query patterns so reports run in seconds rather than minutes. Cost controls and query governance so a runaway query doesn't generate a surprise cloud bill.

  • 03

    BI dashboard development

    Dashboards built on Metabase, Looker, Power BI, Tableau, or custom React with Recharts or D3.js - whichever fits your team and your infrastructure. Each dashboard built against agreed metric definitions so the number on the CEO's dashboard matches the number on the finance team's dashboard. User testing with the actual ops team before handover, not just a demo to the person who commissioned the project. Training session included so the team knows how to filter, drill down, and build their own questions without calling an analyst.

  • 04

    Real-time analytics

    Event tracking pipelines for applications that need near-real-time visibility - user actions, transactions, operational events. Stream processing using Kafka or Pub/Sub for high-volume event data. Live dashboards for operational monitoring (order throughput, queue depth, support ticket volume) where a 30-minute lag would mean acting on stale information. Rate-controlled ingestion to handle traffic spikes without dropping events.

  • 05

    Sales and revenue analytics

    Revenue data unified from your CRM, payment platform, and ERP into a single model. MRR/ARR tracking for subscription businesses with new, expansion, churn, and contraction cohorts separated. Sales pipeline analytics - stage conversion rates, average deal size, cycle time by segment and rep. Forecast accuracy tracking so you know whether your pipeline is a reliable signal or wishful thinking. Cohort analysis showing how different customer acquisition periods perform over time.

  • 06

    Operational analytics

    Dashboards for ops teams that need to see what's happening in the business today, not last week. Logistics and fulfilment: order throughput, cycle time per step, SLA attainment rate. Support operations: ticket volume by channel, first response time, CSAT by team and period. Finance operations: cash position, receivables ageing, burn rate. Each dashboard built for the person running that function, with the specific questions they need answered - not a generic template applied to every department.

  • 07

    Customer behaviour analytics

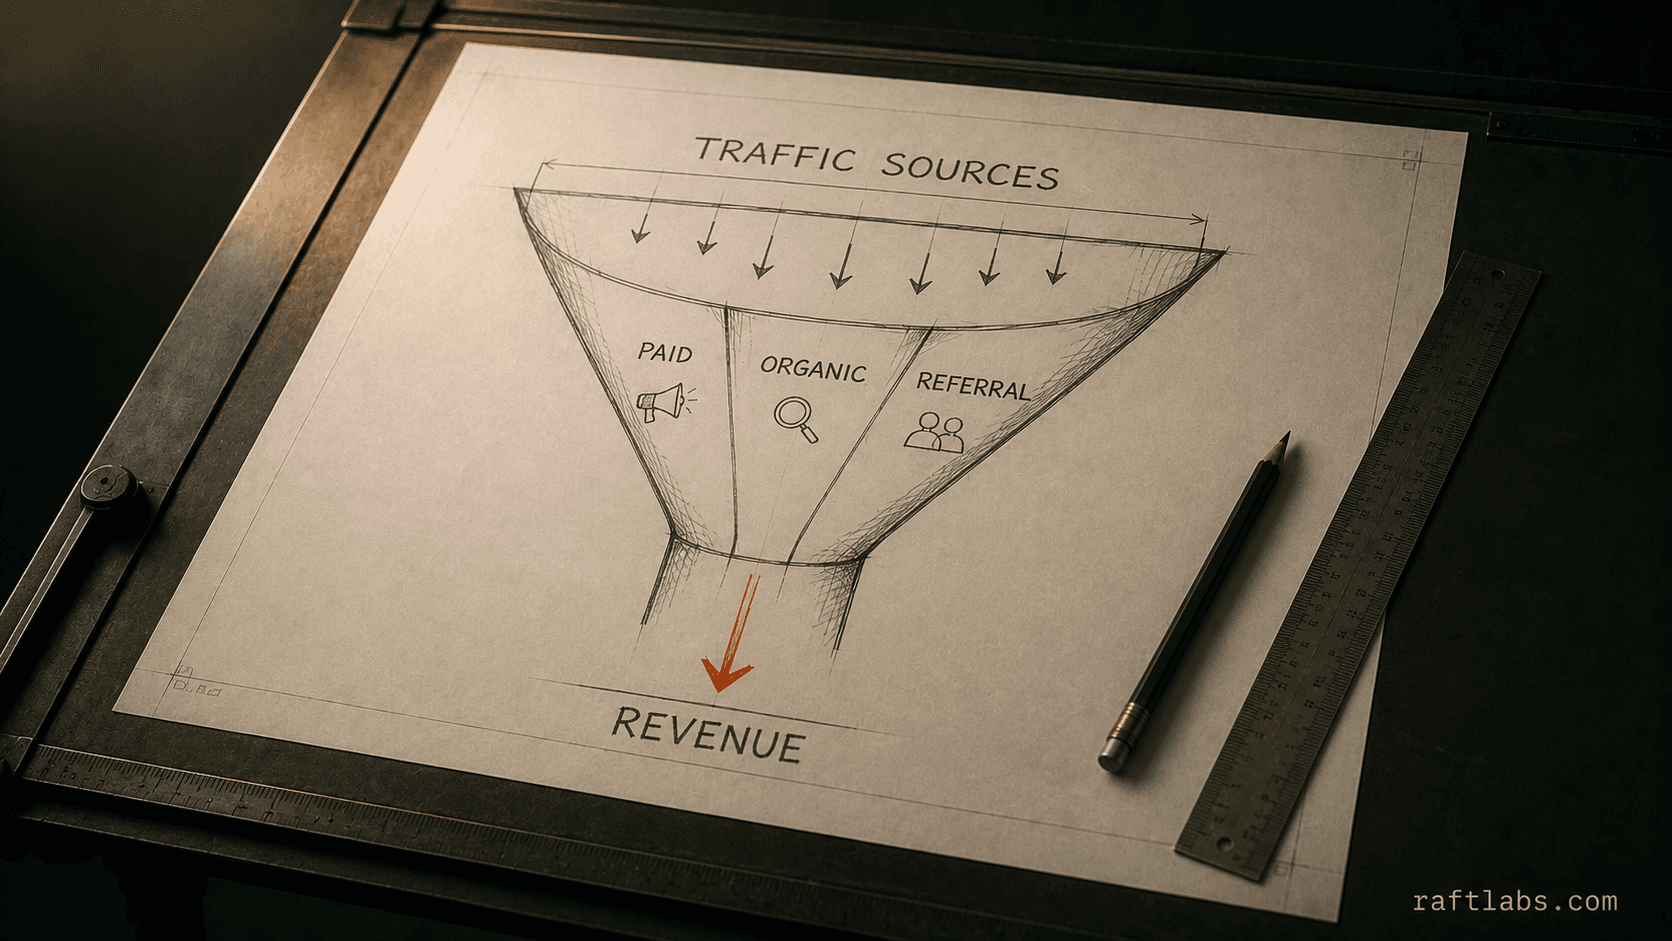
    Customer-level analytics built from event data, CRM records, and transaction history. Retention and churn analysis by acquisition cohort, customer segment, and product. LTV modelling by channel, segment, and tenure. Product usage analytics for SaaS businesses - feature adoption, session patterns, activation rate, time to value. Funnel analysis with drop-off by step and attribution by traffic source. Behavioural segments that your marketing and product teams can act on directly.

  • 08

    Data quality and monitoring

    Data quality checks built into the pipeline so broken data doesn't silently reach dashboards. Row count validation per source table. Schema drift detection when a source API changes its field names without notice. Null checks and range validation for critical fields (you know revenue can't be negative; the pipeline should flag it when it is). Alerting to Slack or email when a pipeline run fails or a quality check fails. A data quality dashboard showing the last successful run time for every source so your team can tell at a glance whether the numbers they're looking at are fresh.

Why us

Why teams choose RaftLabs

  • 01
    Senior engineers build what they scope

    The engineers who assess your data problem also build the pipeline and dashboards. No bait-and-switch, no offshore handoff after the contract is signed. The team you meet in week 1 ships in week 10.

  • 02
    Fixed price before development starts

    We scope the work, calculate the cost, and lock it in writing before any development starts. A scope change is a change request: priced, agreed, or dropped. It never absorbs into the project and appears on the final invoice.

  • 03
    9 years and 100+ products shipped

    Clients include Vodafone, T-Mobile, Aldi, Nike, Cisco, and Lockheed Martin. Track record across AI, SaaS, data engineering, and automation across healthcare, fintech, logistics, and retail.

  • 04
    Compliance built in from the start

    GDPR, HIPAA, SOC 2 - compliance requirements are scoped in week 1, not retrofitted before launch. We have shipped HIPAA-compliant data systems for US healthcare clients and GDPR-compliant analytics for European markets.

What business question can't your team answer right now because the data isn't there?

Tell us your data situation and what decisions it's blocking. We'll scope the analytics system that fixes it.

What clients say

What clients say about working with us

Three-year average engagement. Founders and operators describing the work in their own words. No marketing varnish.

Jennyfer Ngueno
Jennyfer Ngueno
West Africa flagWest Africa
CoFounder & CEO, Sekou

RaftLabs has been an exceptional partner. From the start, they became more than just a service provider, they embraced our vision with their expertise and dedication. We're proud of the result.

01 / 06

Data Analytics Services | RaftLabs, scoped in one call.

Tell us what's broken. Within one business day you get a straight take on cost, timeline, and the right first step. No deck, no pressure.

Stay on topic

More on data & analytics

Frequently asked questions

A focused analytics engagement - connecting 2-3 data sources, building a warehouse layer, and delivering a dashboard - typically runs $15,000-$30,000. A full analytics system covering multiple data sources, custom ETL pipelines, data quality monitoring, and multiple dashboards for different teams runs $30,000-$60,000. The final scope depends on the number of source systems, the complexity of your data model, and how many dashboards you need. RaftLabs scopes every project at a fixed price after an initial assessment of your data sources and reporting requirements.

We connect any system with an accessible data layer. Common sources we work with: CRMs (Salesforce, HubSpot, Pipedrive), ERPs (NetSuite, SAP), e-commerce platforms (Shopify, WooCommerce), databases (PostgreSQL, MySQL, MSSQL, MongoDB), REST APIs (any SaaS tool with an API), spreadsheets and CSVs, Google Analytics and GA4, payment platforms (Stripe), and data lakes in S3 or GCS. If you have a source that isn't on this list, tell us what you're working with and we'll assess it.

Both. The pipeline is the foundation - without clean, reliable data flowing into one place, a dashboard is just a lie in a chart. RaftLabs builds the pipeline first, validates data quality, then builds the dashboards on top. Skipping the pipeline and bolting dashboards directly onto production databases is a pattern we see fail regularly. We don't do it.

Metabase, Looker, Power BI, Tableau, Grafana, and custom React dashboards with Recharts or D3.js. For most businesses, Metabase is the default starting point - it's open source, accessible to non-technical users, and works well for operational dashboards. Power BI is the right choice for teams already in the Microsoft ecosystem. Custom React dashboards make sense when the analytics need to live inside your product rather than in a standalone tool. We recommend the tool that fits your team's technical capacity and your infrastructure, not the one with the highest margin for us.

No. Most clients come to RaftLabs without one. Part of our work is selecting and configuring the right warehouse for your data volume and query patterns. We work with BigQuery, Snowflake, Redshift, and Postgres depending on your scale and cloud provider. If you already have a warehouse, we assess what's there and build on it where it's sound. If it has structural issues, we tell you before we start building anything on top of it.

Yes. We sign an NDA before any discovery session where you share business data, financials, or system architecture. This applies to every engagement regardless of size. Most clients request NDA signature before the first scoping call; we accommodate that. All team members who access your data are bound by the same agreement.

Work with us

Tell us what you need. We'll tell you what it would take.

We scope Data Analytics Services | RaftLabs in 30 minutes. You walk away with a clear cost, timeline, and approach. No commitment required.

  • Scope and cost agreed before work starts. No surprises. No obligation.
  • Working prototype within 3 weeks of kickoff.
  • Pay by milestone. You see progress before each invoice.
  • 60-day post-launch warranty. Bug fixes, UI tweaks, and deployment support. No retainer.
  • All conversations are NDA-protected.